Projected financial statement analysis is a technique that allows an organization to examine the expected results of strategies being implemented. This analysis can be used to forecast the impact of various implementation decisions (for example, to increase promotion expenditures by 50 percent to support a market-development strategy or to increase research and development expenditures by 70 percent to support product development). Most financial institutions require at least three years of projected financial statements whenever a business seeks capital. A projected income statement and balance sheet allows an organization to compute projected financial ratios under various scenarios. When compared to prior years and to industry averages, financial ratios provide valuable insights into the feasibility of various strategy-implementation approaches.
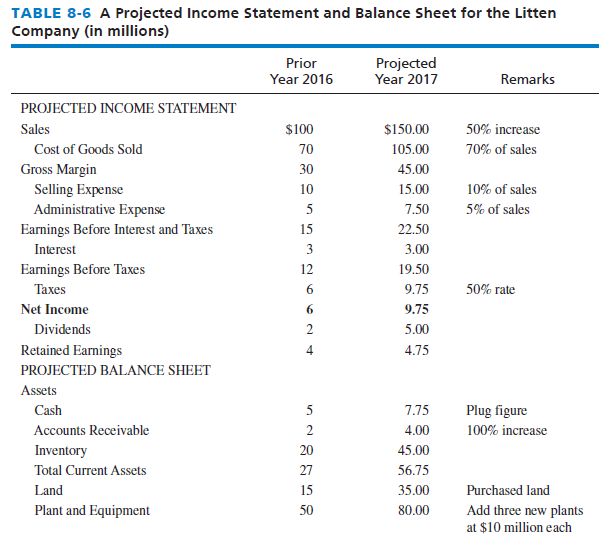
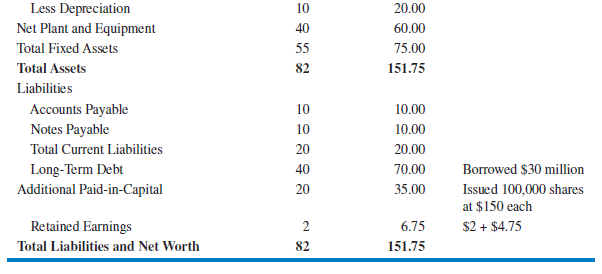
A 2017 projected income statement and a balance sheet for the Litten Company are provided in Table 8-6. The projected statements for Litten are based on five assumptions: (1) The company needs to raise $45 million to finance expansion into foreign markets; (2) $30 million of this total will be raised through increased debt and $15 million through common stock; (3) sales are expected to increase 50 percent; (4) three new facilities, costing a total of $30 million, will be constructed in foreign markets; and (5) land for the new facilities is already owned by the company. Note in Table 8-6 that Litten’s strategies and their implementation are expected to result in a sales increase from $100 million to $150 million and in a net increase in income from $6 million to $9.75 million in the forecasted year.
Projected financial analysis can be explained in seven steps:
- Prepare the projected income statement before the balance sheet. Start by forecasting sales as accurately as possible. Be careful not to blindly push historical percentages into the future with regard to revenue (sales) increases. Be mindful of what the firm did to achieve those past sales increases, which may not be appropriate for the future unless the firm takes similar or analogous actions (such as opening a similar number of stores, for example). If dealing with a manufacturing firm, also be mindful that if the firm is operating at 100 percent capacity running three 8-hour shifts per day, then probably new manufacturing facilities (land, plant, and equipment) will be needed to increase sales further.
- Use the percentage-of-sales method to project cost of goods sold (CGS) and the expense items in the income statement. For example, if CGS is 70 percent of sales in the prior year (as it is in Table 8-6), then use that same percentage to calculate CGS in the future year— unless there is a reason to use a different percentage. Items such as interest, dividends, and taxes must be treated independently and cannot be forecasted using the percentage-of-sales method.
- Calculate the projected net income.
- Subtract from the net income any dividends to be paid for that year. This remaining net income is retained earnings (RE). Bring this retained earnings amount for that year (NI – DIV = RE) over to the balance sheet by adding it to the prior year’s RE shown on the balance sheet. In other words, every year, a firm adds its RE for that particular year (from the income statement) to its historical RE total on the balance sheet. Therefore, the RE amount on the balance sheet is a cumulative number rather than money available for strategy implementation. Note that retained earnings is the first projected balance sheet item to be entered. As a result of this accounting procedure in developing projected financial statements, the RE amount on the balance sheet is usually a large number. However, it also can be a low or even negative number if the firm has been incurring losses. The only way for RE to decrease from one year to the next on the balance sheet is (1) if the firm incurred an earnings loss that year or (2) the firm had positive net income for the year but paid out dividends more than the net income. Be mindful that RE is the key link between a projected income statement and balance sheet, so be careful to make this calculation correctly.
- Project the balance sheet items, beginning with retained earnings and then forecasting shareholders’ equity, long-term liabilities, current liabilities, total liabilities, total assets, fixed assets, and current assets (in that order), working from the bottom to the top of the balance sheet.
- Use the cash account as the plug figure—that is, use the cash account to make the assets total the liabilities and net worth. Then make appropriate adjustments. For example, if the cash needed to balance the statements is too small (or too large), make appropriate changes to borrow more (or less) money than planned. If the projected cash account number is too high, a firm could reduce the cash number and concurrently reduce a liability or equity account the same amount to keep the statement in balance. Rarely is the cash account number perfect on the first pass-through, so adjustments are needed and made.
- List commentary (remarks) on the projected statements. Any time a significant change is made in an item from a prior year to the projected year, an explanation (comment) should be provided. Comments/remarks are essential because otherwise changes can be difficult to understand.


The U.S. Securities and Exchange Commission (SEC) conducts fraud investigations if projected numbers are misleading or if they omit information that is important to investors. Projected statements must conform with generally accepted accounting principles (GAAP) and must not be designed to hide poor expected results. The Sarbanes-Oxley Act requires CEOs and CFOs of corporations to personally sign their firms’ financial statements attesting to their accuracy. These executives could thus be held personally liable for misleading or inaccurate statements. Some firms still “inflate” their financial projections and call them “pro formas,” so investors, shareholders, and other stakeholders must still be wary of different companies’ financial projections.7
On financial statements, different companies use different terms for various items, such as revenues or sales used for the same item. Net income, earnings, or profits can refer to the same item on an income statement, depending on the company.
Source: David Fred, David Forest (2016), Strategic Management: A Competitive Advantage Approach, Concepts and Cases, Pearson (16th Edition).

Appreciate it for this post, I am a big fan of this web site would like to go on updated.