The Federal Reserve System (www.federalreserve.gov), often referred to as “the Fed,” is the independent federal organization that determines and implements monetary policy for the United States. The Federal Reserve’s policy regarding the money supply is the principal determinant of short-term interest rates. The Federal Reserve has three main tools for adjusting the money supply: changing the amount of reserves that banks are required to hold, changing the discount rate, and buying and selling U.S. Treasury and federal agency securities through its open market operations.
When the Federal Reserve purchases any kind of security, it adds money to the banking system. Because banks then have more cash in reserve, they are more likely to make loans, and interest rates tend to fall. Another way to look at this relationship is that the Fed’s purchase of bills and bonds represents increased demand for bills and bonds. As the demand for bills and bonds rises, bill prices rise and short- and long-term interest rates decline.
Fed selling of government securities has exactly the opposite impact. As money is used to pay for these securities, reserves are drained from the banking system. When there is less money in the banking system, banks can make fewer loans, and interest rates tend to rise. Fed selling of government securities represents an increased supply of securities in the marketplace, and, thus, the price of these securities falls. As bill prices fall, interest rates rise.
The Fed uses open market operations to reach a federal funds rate target. The federal funds rate is the interest rate at which banks borrow from each other. Although the federal funds rate is not set by the Federal Reserve, Fed action greatly impacts this rate. If the Federal Reserve makes open market purchases, banks will have more money in reserve. Fewer banks will need to borrow reserves from other banks, and more banks will have excess reserves that they want to lend. This, in turn, places downward pressure on the federal funds rate. When the Fed sells securities, bank reserves decrease, and as bank reserves decline, more banks want to borrow and fewer banks want to lend in the federal funds market. Thus, the federal funds rate will rise.
The Fed implemented expansionary monetary policy in the fall of 2007 by purchasing securities through its open market operations. By the fall of 2008, these open market operations had driven the federal funds rate down to almost zero. Worried about the lack of economic expansion with short-term interest rates near zero, the Fed decided to buy long-term bonds to add money to the financial system and lower long-term interest rates. This policy, called “Quantitative Easing,” or QE, has focused on flattening the yield curve and increasing the reserves banks hold in excess of their required reserves. In September 2008, before quantitative easing began, reserves in the banking system amounted to approximately $11 billion. By the end of 2008, reserves had ballooned to an amazing $860 billion. The amount of reserves has continued to expand, reaching $2.6 trillion by the spring of 2015.
The Federal Open Market Committee (FOMC) meets about every six weeks. At these meetings, the FOMC establishes a federal funds target rate. Although the minutes of each FOMC meeting are not made available to the general public until three weeks after the meeting, the FOMC announces its federal funds target rate in a statement released at the conclusion of the meeting. By implication, this federal funds rate target tells the public whether the Federal Reserve is pursuing a restrictive or expansionist policy. Because short-term interest rates are so important to business and the stock market, and because the Federal Reserve has such a large impact on short-term interest rates, it is important for the analyst to be aware of Fed policy and the subtle changes in that policy.
1. The Federal Reserve Valuation Model
Even though the Federal Reserve is in charge of monetary policy and is concerned with the overall health of the economy and the financial markets, the Federal Reserve seldom makes direct comments about the health of the stock market. However, economist Ed Yardeni (www.yardeni.com), in the back pages of a Fed report, discovered the Greenspan Model, also known as the Fed’s Stock Valuation Model. As shown in Figure 10.13, this model gives a general indication of whether the Federal Reserve sees the stock market as overvalued or undervalued. It is a valuation model that determines if the stock market is too high or low based on the stock market earnings yield relative to yield on the ten-year U.S. note, similar to the timing model in Figure 10.11. Although this is an extremely easy-to-calculate indicator of general market value, there are several criticisms of this model. The principal criticisms of the model are that (1) it is too simplistic, (2) a better correlation exists between actual reported earnings than estimated earnings, and (3) it doesn’t include inflation, an important factor in determining long-term interest rates.

2. Federal Funds
Federal funds, known as fed funds, are short-term, often overnight, loans made between banks. A bank with excess reserves can lend them to a bank that does not have enough reserves to meet its reserve requirements. The interest rate charged for this loan is negotiated between the banks. However, the Federal Reserve has significant influence over this rate through its open market operations. The Federal Open Market Committee sets a target range for the fed funds rate. Changes in the rate indicate potential changes in the Federal Reserve’s policy and thus are watched closely.
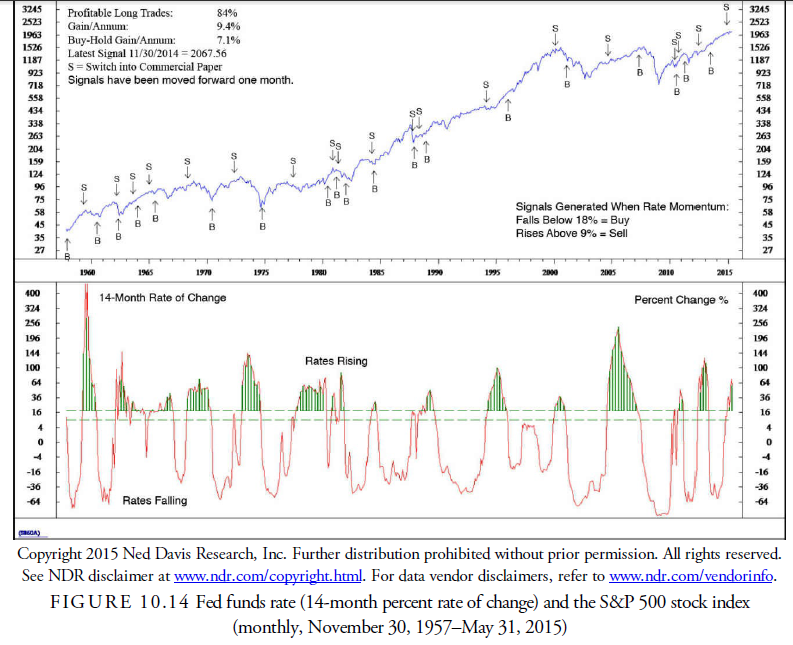
Figure 10.14 shows a chart of the 14-month percent change in the fed funds rate and its corresponding signal for the stock market. Ned Davis Research, Inc. has found that a momentum decline of 18% is sufficient to generate a buy signal in the stock market, and a 9% or more rise in momentum is sufficient to sell the stock market. The signals have been 84% accurate since 1957.
3. Free Reserves
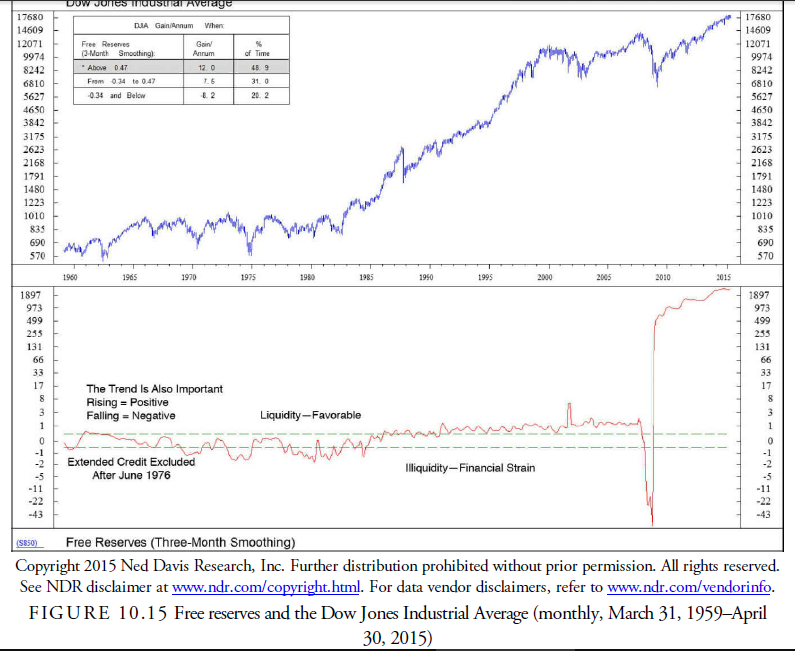
Free reserves are the amount of money banks have over that which they are required to keep for risk management that is free for lending. It is a figure that has been used in stock market timing for many years. After the quantitative easing by the Fed in 2008, excess reserves in the banking system swelled because the downward pressure from the purchase of bonds on the long-term interest rate squeezed the yield curve, making it unprofitable for banks to lend. Added to this concern was the introduction of the Dodd-Frank Bill that placed many undefined restrictions on the banking system. The net of all this was that banks held back from lending, and their excess cash from earnings remained in house, thus enlarging their excess reserves. Because there is a positive correlation between excess free reserves and the stock market, the stock market advanced strongly. The model in Figure 10.15 by Ned Davis Research, Inc. shows how increased liquidity in the banking system from excess free reserves coincided with a strong stock market. Whenever the three-month smoothed average of free reserves rose above 0.47, the stock market had an annualized gain of 12.0%, and when the free reserves declined below -0.34, the stock market declined an annualized 8.2%.
4. Three Steps and a Stumble and Two Tumbles and a Jump
In line with the desire to measure when the Federal Reserve is tightening credit, Edson Gould, a legendary technical analyst from the 1930s through the 1970s, developed a simple rule about Federal Reserve policy that has an excellent record of foretelling a stock market decline. The rule states that “whenever the Federal Reserve raises either the federal funds target rate, margin requirements, or reserve requirements three consecutive times without a decline, the stock market is likely to suffer a substantial, perhaps serious, setback” (Schade, 1991). This simple rule is still relevant. Although it tends to lead a market top, it is something that should not be disregarded. As shown in Figure 10.16, the rule has been followed by a median decline of 17%. Only two possible incorrect signals were given since 1915: the 1928 signal, prior to the 1929 crash, was possibly too early, and the 1978 signal was probably too late. Thus, this signal has an accuracy record of at least 89.0%.

The Two Tumbles and a Jump indicator was first mentioned in Fosback’s 1973 edition of Market Logic. It is essentially the opposite of Gould’s Three-Step rule. Although it uses changes in the fed funds target rate, margin requirements, and reserve requirements, it looks for two consecutive declines, or tumbles, in any of these policy variables. It has an excellent history of predicting the stock market rises. As Figure 10.14 demonstrates, the percentage of accuracy since 1915 is 84%, with some of the errors considered questionable.
One way to use these two interest rate indicators, which the evidence shows to be superior, is to take them as warnings of important changes in market direction. They are not necessarily strict signals by themselves. However, if a signal is acted upon, to avoid major loss from a false signal, the action must be reversed if the market turns in the opposite direction implied by the signal. For example, if the Three-Step rule gives a sell signal and the market begins to decline, a buy signal will be generated if either the market breaks above its earlier highs or a Two-Tumble signal occurs. The same protection can be used for the Two-Tumble rule in the opposite direction. Essentially, these are “stops” that would prevent any major loss from future incorrect signals, rare as they may be.
Source: Kirkpatrick II Charles D., Dahlquist Julie R. (2015), Technical Analysis: The Complete Resource for Financial Market Technicians, FT Press; 3rd edition.
Pretty part of content. I just stumbled upon your website and in accession capital to claim that I acquire actually enjoyed account your blog posts. Any way I will be subscribing to your feeds or even I success you get admission to consistently quickly.