According to exhaustive research on technical analysis by Lo and Hasanhodzic (2010), the earliest known recording of commodity prices with the intent to predict from them was in ancient Babylonia in the first millennium B.C. These recordings were diaries of traders and astronomers who were attempting to correlate astrology with price changes. By the fifth and sixth centuries A.D., price charts, similar to those used presently, were developed in China, Europe, and Japan. The Chinese were interested in cyclicality of prices; the Europeans were interested in astrology; and the Japanese developed the candlestick chart that is still in use today. The “opening of commodity exchanges in Western Europe (1561) and Japan (1654) provided the necessary environment for the development of the chart” (Shimizu, 1986, p. 14). At the time of these exchanges, freely traded markets had become sophisticated enough to produce multiple prices during a trading day and, thus, the requirement for recording the high, low, and close price of each commodity traded on the exchange. It was only natural that this information was portrayed in graphic form. By the 1830s, just before the invention of the ticker tape for the stock exchanges, several chart vendors in New York sold published charts on stock and commodity prices.
The information charted and the method of charting often flows from how the market being analyzed operates. For example, the current use of high and low in a bar chart is not feasible in those trading markets that settle a price only once a day.
Plausibly, the first type of chart was just a simple plot on paper of a number—either amount or price—and a date. In early Japan, for example, rice was traded by amount. Instead of a price per bag, it was the number of bags per price that was recorded by the famous rice trader Sokyu Honma in the 1750s. As markets began to trade more frequently during the day, the chart became more complex. A high and low price could be recorded, and eventually as multiple trades occurred, an open and close price could be added. Volume was recorded much later when more complete and public records were available. At first, witnesses located in the marketplace recorded prices. Eventually, markets became better organized, and prices and amounts were publicly available.
The growth of this business is of great monument to the stock exchange, for it is through the instant dissemination of the quotations made on its floor that the active and continuous interest in the markets is sustained. (Horace L. Hotchkiss, founder of the Gold Stock and Telegraph Company)
The invention of the ticker and the ticker tape revolutionized technical analysis and charting. Shortly after Thomas Edison invented a machine called the Edison Telegraph Printer to print messages from a telegraph, in 1867 Edward A. Calahan, an employee of the American Telegraph Company, invented the ticker tape. Eventually, it was improved upon and patented by Thomas Edison in 1871. This invention not only made conventional charting easier but also allowed for point and figure charting, because such charts required knowledge of every price at which an item had traded during the day. Without the ticker tape, the gathering of this information would have been difficult in markets with multiple trades during a day.
Box 11.2 W hat is a Tick er Tape?
A tick is any change, up or down, in the price of a stock (or any other traded security). Information regarding stock transactions is recorded on a ticker tape. By watching the ticker tape, an investor is able to keep abreast of changes in stock prices. The first ticker tape was developed in 1867, following the invention of the telegraph machine. This technology allowed information to be printed in a shorthand format on a narrow strip of paper, or tape. Messengers would run a circuit between the New York Stock Exchange (NYSE) trading floor to brokers’ offices, delivering tapes of the most recent transactions. Brokers would place an office near the NYSE because the closer they were to the trading floor, the more quickly they could get ticker tapes and the more up to date their information about recent stock transactions would be. Technology improved over the years, providing faster access to stock transaction data. In the hectic trading days of the late 1960s and early 1970s, the ticker could not keep up with trading, and there was a period when the markets were closed on Wednesdays to facilitate the clearing of trades. Not until 1996 did the real-time electronic ticker provide up-to-the-minute transaction data. Today, you will see immediate stock market transaction figures on TV news shows and Web sites. Although these figures are reported electronically, and the actual tape is no longer used, the name “ticker tape” is still used when a running list of trades is shown on TV or a quote machine.
When you are watching a ticker tape, you will see information recorded in a format such as this:
HPQ2K@23.l6-1.09
or
Ticker Symbolshares Traded@ Price Traded, Change Direction, Change Amount
The first information given is the ticker symbol; these unique characters identify a particular company’s stock. In the preceding example, HPQ indicates that this information is for the common stock of Hewlett-Packard Co. Next, the volume of shares traded appears. 2K indicates that 2,000 shares were traded. The price per share for the particular trade is then quoted. Next, an up or down triangle appears, indicating whether this trading price is higher or lower than the previous day’s closing price. Finally, the difference between the current trading price and the previous closing price is reported. Reading this ticker tape, we can tell that 2,000 shares of Hewlett-Packard stock just traded at $23.16 a share. We can also tell that this is $1.09 higher than the previous day’s closing price of $22.07.
Modern technology has greatly simplified the task of chart construction. Computer power has replaced much of the tedious human work. Now, even basic home computers have spreadsheet programs, such as Microsoft Excel, that can store daily stock price data and create a variety of charts used by technical analysts. In addition, other sophisticated software programs that are specifically designed for technical analysis are readily available. These programs not only plot charts and indicators or oscillators but also can test trading rules. Examples are AIQ, Amibroker (www.amibroker.com), eSignal (www.signal.com), High Growth Stock Investors (www.hgsi.com), Metastock (www.equis.com), Neuroshell Trader (www.neuroshell.com), Ninjatrader (www.ninjatrader.com), Thinkorswim (www.thinkorswim.com), Tradersstudio (www.tradersstudio.com), TradeStation (www.tradestation.com), Updata (www.updata.co.uk). and Wealth- Lab (www.wealth-lab.com). In addition to charting software, the Web hosts many charting sites, examples of which are StockCharts.com, www.bigcharts.com,finance.yahoo.com, and freestockcharts.com. Today, the technical analyst can focus much more time and attention on analysis and much less on chart construction.
Over the years, technicians developed several different approaches to chart construction. The four main categories of charting that we discuss in this chapter are line charts, bar charts, candlestick charts, point and figure charts, and other charts with no indication of time. Each approach has its own features, benefits, and drawbacks. Whichever method a technical analyst chooses to use, charts serve as the technical analyst’s road map. Charts give a quick and concise picture of past price action.
For example, look at Table 11.1. This table contains the daily reported prices for Apple Computer (AAPL) for the month of May 2015.
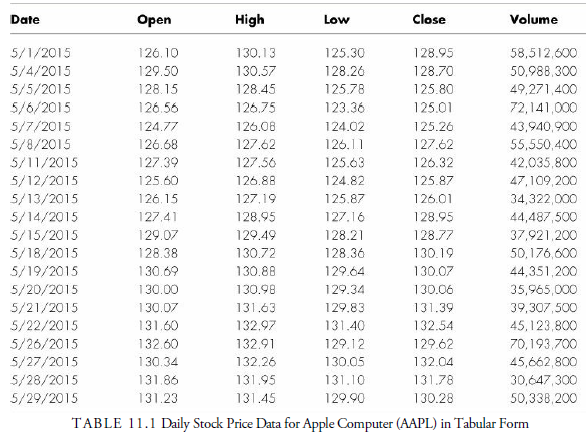
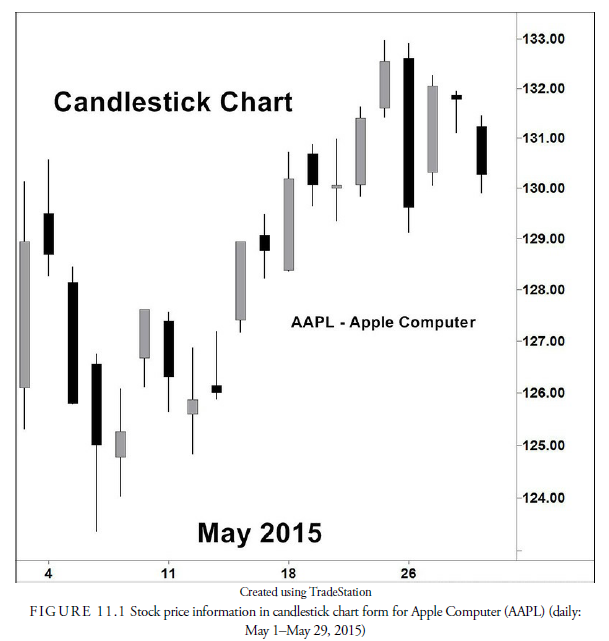
It is difficult to look at the 20 closing prices in this table and get an idea of whether the stock price trend is up, down, or sideways. Now look at Figure 11.1. This chart contains the same information as Table 11.1. Notice how much easier it is to process the information when it is provided in the picture form of Figure 11.1 rather than in tabular form. As the old saying goes, “A picture is worth a thousand words.” With just a glance at the chart, you have a road map of where prices have been; in a fraction of a second, you can easily spot the highest prices and lowest prices that occurred during the period. A chart quickly transforms a table of data into a clear visual representation of the information.
Source: Kirkpatrick II Charles D., Dahlquist Julie R. (2015), Technical Analysis: The Complete Resource for Financial Market Technicians, FT Press; 3rd edition.
I am incessantly thought about this, thanks for posting.