The interest rate represents the price of borrowing funds. It is the cost that borrowers have to pay to use money; the higher the price, the less likely borrowers are to borrow. It is also the reward that lenders receive for letting someone borrow their money; investors compare this return with the expected return in other markets, such as the stock market, when they decide where to allocate their funds.
1. Short-Term Interest Rates
The theory behind using short-term interest rates as stock market signals is based on two assumptions. First, interest-bearing investments are alternatives to stock investments. In other words, savers make choices about placing their investment funds in interest-bearing securities or the stock market. When interest rates are relatively high, the interest-bearing securities look relatively more enticing. Second, interest rates directly affect costs for corporations and, thus, corporate earnings. However, the interest rate itself is important because the expected rate of return in the stock market must be greater than the short-term interest rate for investors to invest. When interest rates begin to rise, while the stock market languishes, investment outlooks begin to change. On the corporate and personal level, rising rates translate into rising costs. Whether it is working capital borrowing or adjustable rate mortgage payments, increases in short-term rates have a negative effect on net income and, by extension, on confidence. Alternatively, when rates decline, costs also decline and confidence builds. Furthermore, and regardless of potential reasons, short-term interest rates correlate closely but inversely with stock market behavior. Knowing when a major switch in direction in short-term interest rates has occurred is important for a probable switch in stock market direction.
Federal Reserve policy indicators and short-term interest rates are generally very accurate, although often early, as a predictor of stock market direction. Figure 10.9 shows the relationship between short-term interest rate movements and the S&P 500. During the speculative bubble from 1998-2000 and its collapse into 2002, however, interest rates had little effect upon the market’s direction. Emotion had overcome logic, and the relationship between short-term interest rates and the market was abandoned for greed to make easy money and fear of missing the next upward wave in stock prices. Again, in the period between 2007 and 2009, when the stock market collapsed to a new 10-year low, lower short-term interest rates had no positive effect on the stock market. Financial jargon calls this behavior pushing on a string, when short-term rates do not cause incentives to buy stocks. The last time rates did not work was in the 1920s speculative bubble and early 1930s collapse. They were reliable for more than 50 years thereafter.

2. Long-Term Interest Rates (or Inversely, the Bond Market)
Long-term interest rates are related to, but not perfectly correlated to, short-term interest rates. The Federal Reserve effectively controls short-term interest rates through its various policy measures, but it does not have as tight control of the long-term market. When we speak of long-term interest rates, we speak of the bond market. Long-term interest rates and bond prices are inversely related. When long-term interest rates rise, bond prices fall, and when long-term interest rates fall, bond prices rise.
Relationships between the bond market and the stock market also exist. The relationships between bonds and stocks have much to do with the payout for security holders, coupon payments for bondholders, and dividends and earnings yield for stockholders. Generally, investors view bonds as long-term investments with a steady, fixed coupon return, whereas stocks are long-term investments with a variable, less predictable return. Both markets, however, can fluctuate widely.
For long-term outlooks (as opposed to long-term interest rates), therefore, it is important to know the historical relationship between these investments. As a rule, long-term bonds have tended to move in the same direction as the stock market. In other words, long-term interest rates have tended to move in the opposite direction from the stock market. As the bond market makes a major bottom, the stock market often makes a major bottom also. At tops, the bond market tends to lead the stock market and is, thus, very often, an early indicator of trouble ahead for the stock market. As in short-term interest rates, this relationship broke down during the period of the speculative bubble and collapse between 1998 and 2002 and between 2007 and 2009.
Prior to those periods, the relationship had been steady for more than 50 years and will likely return. See Figure 10.10 for the relationship between long-term Treasury bond yields and the S&P 500 over the past 50 years.
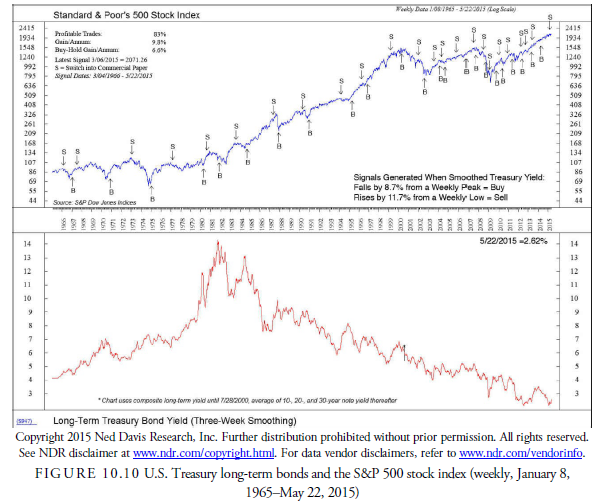
Ned Davis Research developed a simple trading rule for long-term interest rates. It is the number of points a three-week moving average changes, up or down. If the long-rate measure declines by 8.7% from a weekly peak, a buy signal is generated. On the other hand, a sell signal is generated when the long-term rate average advances 11.7% from a weekly low. The performance history of this simple method produced an average annual return of 9.8% in the S&P 500 over the past 50 years. This is compared with a buy-and-hold gain of only 6.6%.
3. Corporate Bond and Stock Market Yield Spread
If we consider the inverse of the P/E ratio for stocks as the stock yield—that is, the earnings return percentage of the stock’s market price, and the yield on average corporate bonds, the Moody’s Baa Bond index —in a ratio format, we should see how they are performing against each other and learn about which market, the stock or bond market, has the highest current return. In Figure 10.11, we show the Ned Davis Research, Inc. plot of this ratio and the signals it has generated for the stock market (and conversely for the bond market as the alternative investment). When the bond market is performing better than the stock market by 4.6 percentage points, the annualized gain in the stock market has been minus 4.4%. When the bond market has fallen behind the stock market by 3.4 percentage points, the annualized gain in the stock market has risen to plus 16.7%.

5. The Misery Indices
The economist Arthur Okum designed the misery index in the 1960s during the Johnson administration when inflation was a special concern. Inflation, coupled with high unemployment, resulted in what economists call stagflation. Okum created the index in an attempt to measure the social and economic cost of high inflation and high unemployment. A high Misery Index indicated that the combination of inflation and unemployment was high and that investors were experiencing a more stressful economic environment. Later, in 1999, Robert Barro of Harvard added an interest component and the spread, positive or negative, between the GDP actual and trend rate of growth to create the Barro Misery Index (BMI). The more common version today includes the interest rate, either prime rate or mortgage rate, but not the GDP trend information.
Figure 10.12 shows how the level of the misery index has related to the performance of the DJIA since 1966. This figure shows the results of buying the DJIA whenever misery index falls by 0.3 points and selling the DJIA whenever the index rises by 3.2 points. The trading accuracy of this system is 75% favorable, and its gain per annum is greater than the buy-and-hold gain per annum by 3.7%. Because the calculation of the misery index is easy and low cost, the profitable results of this trading system appear valuable.

Source: Kirkpatrick II Charles D., Dahlquist Julie R. (2015), Technical Analysis: The Complete Resource for Financial Market Technicians, FT Press; 3rd edition.
Good write-up, I?¦m normal visitor of one?¦s web site, maintain up the nice operate, and It is going to be a regular visitor for a lengthy time.