Understanding the marketing environment and conducting marketing research (described in Chapter 4) can help to identify marketing opportunities. The company must then measure and forecast the size, growth, and profit potential of each new opportunity. Sales forecasts prepared by marketing are used by finance to raise cash for investment and operations; by manufacturing to establish capacity and output; by purchasing to acquire the right amount of supplies; and by human resources to hire the needed workers. If the forecast is off the mark, the company will face excess or inadequate inventory. Because it’s based on estimates of demand, managers need to define what they mean by market demand. DuPont’s Performance Materials group knew that even when DuPont Tyvek had 70 percent of the $100 million market for air-barrier membranes, there was greater opportunity with more products and services to tap into the entire multi-billion-dollar U.S. home construction market.55
1. THE MEASURES OF MARKET DEMAND
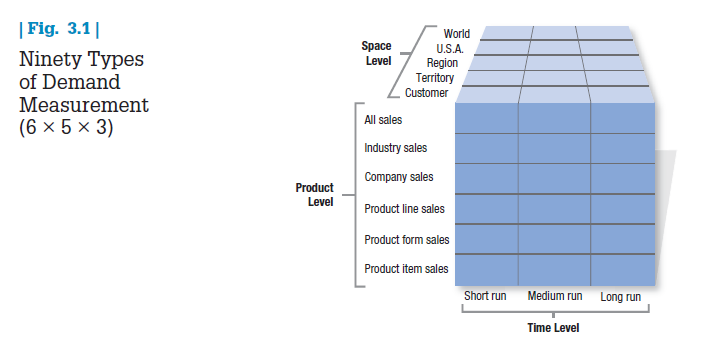
Companies can prepare as many as 90 different types of demand estimates for six different product levels, five space levels, and three time periods (see Figure 3.1). Each serves a specific purpose. A company might forecast short-run demand to order raw materials, plan production, and borrow cash. It might forecast regional demand to decide whether to set up regional distribution.
There are many productive ways to break down the market:
- The potential market is the set of consumers with a sufficient level of interest in a market offer. However, their interest is not enough to define a market unless they also have sufficient income and access to the product.
- The available market is the set of consumers who have interest, income, and access to a particular offer. The company or government may restrict sales to certain groups; a state might ban motorcycle sales to anyone under 21. Eligible adults constitute the qualified available market—the set of consumers who have interest, income, access, and qualifications for the market offer.
- The target market is the part of the qualified available market the company decides to pursue. The company might concentrate its marketing and distribution effort on the East Coast.
- The penetrated market is the set of consumers who are buying the company’s product.
These definitions are a useful tool for market planning. If the company isn’t satisfied with its current sales, it can try to attract a larger percentage of buyers from its target market. It can lower the qualifications for potential buyers. It can expand its available market by opening distribution elsewhere or lowering its price, or it can reposition itself in the minds of its customers.
2. A VOCABULARY FOR DEMAND MEASUREMENT
The major concepts in demand measurement are market demand and company demand. Within each, we distinguish among a demand function, a sales forecast, and a potential.
MARKET DEMAND The marketer’s first step in evaluating marketing opportunities is to estimate total market demand. Market demand for a product is the total volume that would be bought by a defined customer group in a defined geographical area in a defined time period in a defined marketing environment under a defined marketing program.
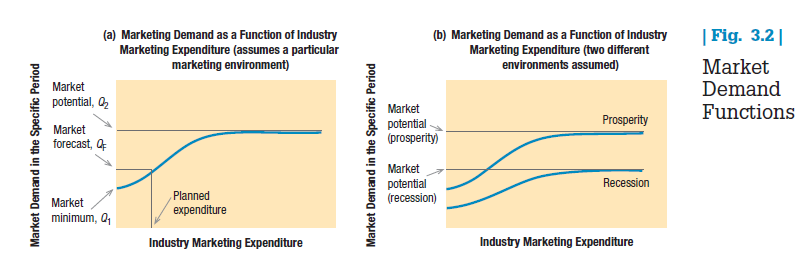
Market demand is not a fixed number, but rather a function of the stated conditions. For this reason, we call it the market demand function. Its dependence on underlying conditions is illustrated in Figure 3.2(a). The horizontal axis shows different possible levels of industry marketing expenditure in a given time period. The vertical axis shows the resulting demand level. The curve represents the estimated market demand associated with varying levels of marketing expenditure.
Some base sales—called the market minimum and labeled Qj in the figure—would take place without any demand-stimulating expenditures. Higher marketing expenditures would yield higher levels of demand, first at an increasing rate, then at a decreasing rate. Take fruit juices. Given the indirect competition they face from other types of beverages, we would expect increased marketing expenditures to help fruit juice products stand out and increase demand and sales. Marketing expenditures beyond a certain level would not stimulate much further demand, suggesting an upper limit called the market potential and labeled Q2 in the figure.
The distance between the market minimum and the market potential shows the overall marketing sensitivity of demand. We can think of two extreme types of markets, the expansible and the nonexpansible. An expansible market, such as the market for racquetball playing, is very much affected in size by the level of industry marketing expenditures. In terms of Figure 3.2(a), the distance between Qj and Q2 is relatively large. A nonexpansible market—for example, the market for weekly trash or garbage removal—is not much affected by the level of marketing expenditures; the distance between Qj and Q2 is relatively small. Organizations selling in a nonexpansible market must accept the market’s size—the level of primary demand for the product class—and direct their efforts toward winning a larger market share for their product, that is, a higher level of selective demand for their product.
It pays to compare the current and potential levels of market demand. The result is the market-penetration index. A low index indicates substantial growth potential for all the firms. A high index suggests it will be expensive to attract the few remaining prospects. Generally, price competition increases and margins fall when the market-penetration index is already high.
Comparing current and potential market shares yields a firm’s share-penetration index. If this index is low, the company can greatly expand its share. Holding it back could be low brand awareness, low availability, benefit deficiencies, or high price. A firm should calculate the share-penetration increases from removing each factor to see which investments produce the greatest improvement.56
Remember that the market demand function is not a picture of market demand over time. Rather, it shows alternate current forecasts of market demand associated with possible levels of industry marketing effort.
MARKET FORECAST Only one level of industry marketing expenditure will actually occur. The market demand corresponding to this level is called the market forecast.
MARKET POTENTIAL The market forecast shows expected market demand, not maximum market demand. For the latter, we need to visualize the level of market demand resulting from a very high level of industry marketing expenditure, where further increases in marketing effort would have little effect. Market potential is the limit approached by market demand as industry marketing expenditures approach infinity for a given marketing environment.
The phrase “for a given market environment” is crucial. Consider the market potential for automobiles. It’s higher during prosperity than during a recession, as illustrated in Figure 3.2(b). Market analysts distinguish between the position of the market demand function and movement along it. Companies cannot do anything about the position of the market demand function, which is determined by the marketing environment. However, they influence their particular location on the function when they decide how much to spend on marketing.
Companies interested in market potential have a special interest in the product-penetration percentage, the percentage of ownership or use of a product or service in a population. The lower the product-penetration percentage, the higher the market potential, although this also assumes everyone will eventually be in the market for every product.
COMPANY DEMAND Company demand is the company’s estimated share of market demand at alternative levels of company marketing effort in a given time period. It depends on how the company’s products, services, prices, and communications are perceived relative to the competitors’. Other things equal, the company’s market share depends on the relative scale and effectiveness of its market expenditures. As noted previously, marketing model builders have developed sales response functions to measure how a company’s sales are affected by its marketing expenditure level, marketing mix, and marketing effectiveness.57
COMPANY SALES FORECAST Once marketers have estimated company demand, their next task is to choose a level of marketing effort. The company sales forecast is the expected level of company sales based on a chosen marketing plan and an assumed marketing environment.
We represent the company sales forecast graphically with sales on the vertical axis and marketing effort on the horizontal axis, as in Figure 3.2. We often hear that the company should develop its marketing plan on the basis of its sales forecast. This forecast-to-plan sequence is valid ifforecast means an estimate of national economic activity or if company demand is nonexpansible. The sequence is not valid, however, where market demand is expansible or where forecast means an estimate of company sales. The company sales forecast does not establish a basis for deciding what to spend on marketing. On the contrary, the sales forecast is the result of an assumed marketing expenditure plan.
Two other concepts are important here. A sales quota is the sales goal set for a product line, company division, or sales representative. It is primarily a managerial device for defining and stimulating sales effort, often set slightly higher than estimated sales to stretch the sales force’s effort.
A sales budget is a conservative estimate of the expected volume of sales, primarily for making current purchasing, production, and cash flow decisions. It’s based on the need to avoid excessive risk and is generally set slightly lower than the sales forecast.
COMPANY SALES POTENTIAL Company sales potential is the sales limit approached by company demand as company marketing effort increases relative to that of competitors. The absolute limit of company demand is, of course, the market potential. The two would be equal if the company captured 100 percent of the market. In most cases, company sales potential is less than the market potential, even when company marketing expenditures increase considerably. Each competitor has a hard core of loyal buyers unresponsive to other companies’ efforts to woo them.
3. ESTIMATING CURRENT DEMAND
We are now ready to examine practical methods for estimating current market demand. Marketing executives want to estimate total market potential, area market potential, and total industry sales and market shares.
TOTAL MARKET POTENTIAL Total market potential is the maximum sales available to all firms in an industry during a given period, under a given level of industry marketing effort and environmental conditions. A common way to estimate total market potential is to multiply the potential number of buyers by the average quantity each purchases and then by the price.
If 100 million people buy books each year and the average book buyer buys three books a year at an average price of $20 each, then the total market potential for books is $6 billion (100 million x 3 x $20). The most difficult component to estimate is the number of buyers. We can always start with the total population in the nation, say, 314 million people. Next we eliminate groups that obviously would not buy the product. Assume illiterate people and children under 12 don’t buy books and constitute 20 percent of the population. This means 80 percent of the population, or 251 million people, is in the potential pool. Further research might tell us that people of low income and low education rarely buy books, and they constitute more than 30 percent of the potential pool. Eliminating them, we arrive at a prospect pool of approximately 175.7 million book buyers. We use this number to calculate total market potential.
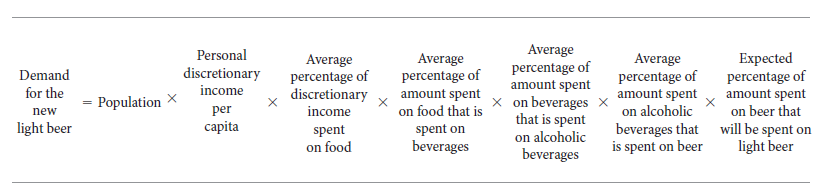
A variation on this method is the chain-ratio method, which multiplies a base number by several adjusting percentages. Suppose a brewery is interested in estimating the market potential for a new light beer especially designed to accompany food. It can make an estimate with the following calculation:
AREA MARKET POTENTIAL Because companies must allocate their marketing budget optimally among their best territories, they need to estimate the market potential of different cities, states, and nations. Two major methods are the market-buildup method, used primarily by business marketers, and the multiple-factor index method, used primarily by consumer marketers.
Market-Buildup Method The market-buildup method calls for identifying all the potential buyers in each market and estimating their potential purchases. It produces accurate results if we have a list of all potential buyers and a good estimate of what each will buy. Unfortunately, this information is not always easy to gather.
Consider a machine-tool company that wants to estimate the area market potential for its wood lathe in the Boston area. Its first step is to identify all potential buyers of wood lathes in the area, primarily manufacturing establishments that shape or ream wood as part of their operations. The company could compile a list from a directory of all manufacturing establishments in the area. Then it could estimate the number of lathes each industry might purchase, based on the number of lathes per thousand employees or per $1 million of sales in that industry.
An efficient method of estimating area market potentials makes use of the North American Industry Classification System (NAICS), developed by the U.S. Bureau of the Census in conjunction with the Canadian and Mexican governments.58 The NAICS classifies all manufacturing into 20 major industry sectors and further breaks each sector into a six-digit, hierarchical structure as follows.
51 Industry sector (information)
513 Industry subsector (broadcasting and telecommunications)
5133 Industry group (telecommunications)
51332 Industry (wireless telecommunications carriers, except satellite)
513321 National industry (U.S. paging)
For each six-digit NAICS number, a company can purchase business directories that provide complete company profiles of millions of establishments, subclassified by location, number of employees, annual sales, and net worth.
To use the NAICS, the lathe manufacturer must first determine the six-digit NAICS codes that represent products whose manufacturers are likely to require lathe machines. To get a full picture of these, the company can (1) identify past customers’ NAICS codes; (2) go through the NAICS manual and check off all the sixdigit industries that might have an interest in lathes; and (3) mail questionnaires to a wide range of companies inquiring about their interest in wood lathes.
The company’s next task is to select an appropriate base for estimating the number of lathes each industry will use. Suppose customer industry sales are the most appropriate base. Once the company estimates the rate of lathe ownership relative to the customer industry’s sales, it can compute the market potential.
Multiple-Factor Index Method Like business marketers, consumer companies also need to estimate area market potentials, but because their customers are too numerous to list, they commonly use a straightforward index. A drug manufacturer might assume the market potential for drugs is directly related to population size. If the state of Virginia has 2.55 percent of the U.S. population, Virginia might be a market for 2.55 percent of total drugs sold.
A single factor is rarely a complete indicator of sales opportunity. Regional drug sales are also influenced by per capita income and the number of physicians per 10,000 people. Thus, it makes sense to develop a multiple- factor index and assign each factor a specific weight. Suppose Virginia has 2.00 percent of U.S. disposable personal income, 1.96 percent of U.S. retail sales, and 2.28 percent of U.S. population, and the respective weights for these factors are 0.5, 0.3, and 0.2. The buying-power index for Virginia is then 2.04 [0.5(2.00) + 0.3(1.96) + 0.2(2.28)]. Thus, 2.04 percent of the nation’s drug sales (not 2.28 percent) might be expected to take place in Virginia.
The weights in the buying-power index are somewhat arbitrary, and companies can assign others if appropriate. A manufacturer might adjust the market potential for additional factors, such as competitors’ presence, local promotional costs, seasonal factors, and market idiosyncrasies.
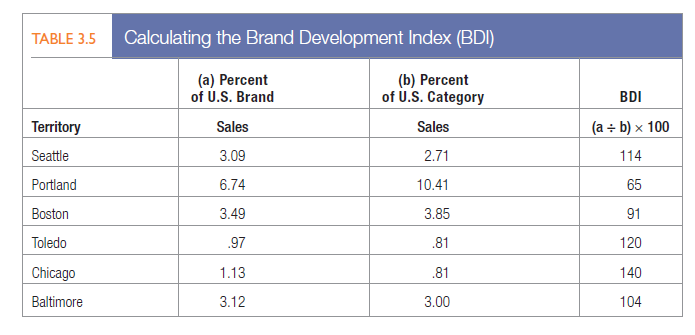
Many companies compute area indexes to allocate marketing resources. Suppose the drug company is reviewing the six cities listed in Table 3.5. The first two columns show its percentage of U.S. brand and category sales in these six cities. Column 3 shows the brand development index (BDI), the index of brand sales to category sales. Seattle has a BDI of 114 because the brand is relatively more developed than the category in Seattle. Portland’s BDI is 65, which means the brand is relatively underdeveloped there.
Normally, the lower the BDI, the higher the market opportunity, in that there is room to grow the brand. Other marketers would argue instead that marketing funds should go into the brand’s strongest markets, where it might be important to reinforce loyalty or more easily capture additional brand share. Investment decisions should be based on the potential to grow brand sales.
Feeling it was underperforming in a high-potential market, Anheuser-Busch targeted the growing Hispanic population in Texas with a number of special marketing activities. Cross-promotions with Budweiser and Clamato tomato clam cocktail (to mix the popular Michiladas drink), sponsorship of the Esta Noche Toca concert series, and support of Latin music acts with three-on-three soccer tournaments helped drive higher sales. Anheuser-Busch later introduced Chelada with pre-mixed Budweiser or Bud Light and Clamato.59
After the company decides on the city-by-city allocation of its budget, it can refine each allocation down to census tracts or zip+4 code centers. Census tracts are small, locally defined statistical areas in metropolitan areas and some other counties. They generally have stable boundaries and a population of about 4,000. Zip+4 code centers (designed by the U.S. Postal Service) are a little larger than neighborhoods. Data on population size, median family income, and other characteristics are available for these geographical units. Using other sources such as loyalty card data, Mediabrands’s Geomentum targets “hyper-local” sectors of zip codes, city blocks, and even individual households with ad messages delivered via interactive TV, zoned editions of newspapers, Yellow Pages, outdoor media, and local Internet searches.60
INDUSTRY SALES AND MARKET SHARES Besides estimating total potential and area potential, a company needs to know the actual industry sales taking place in its market. This means identifying competitors and estimating their sales.
The industry trade association will often collect and publish total industry sales, although it usually does not list individual company sales separately. With this information, however, each company can evaluate its own performance against the industry’s. If a company’s sales are increasing by 5 percent a year and industry sales are increasing by 10 percent, the company is losing its relative standing in the industry.
Another way to estimate sales is to buy reports from a marketing research firm that audits total sales and brand sales. Nielsen Media Research audits retail sales in various supermarket and drugstore product categories. A company can purchase this information and compare its performance to the total industry or any competitor to see whether it is gaining or losing share, overall or brand by brand. Because distributors typically will not supply information about how much of competitors’ products they are selling, business-to-business marketers operate with less knowledge of their market share results.
4. ESTIMATING FUTURE DEMAND
The few products or services that lend themselves to easy forecasting generally enjoy an absolute level or a fairly constant trend and competition that is either nonexistent (public utilities) or stable (pure oligopolies). In most markets, in contrast, good forecasting is a key factor in success.
Companies commonly prepare a macroeconomic forecast first, followed by an industry forecast, followed by a company sales forecast. The macroeconomic forecast projects inflation, unemployment, interest rates,
consumer spending, business investment, government expenditures, net exports, and other variables. The end result is a forecast of gross domestic product (GDP), which the firm uses, along with other environmental indicators, to forecast industry sales. The company derives its sales forecast by assuming it will win a certain market share.
How do firms develop forecasts? They may create their own or buy forecasts from outside sources such as marketing research firms, which interview customers, distributors, and other knowledgeable parties. Specialized forecasting firms produce long-range forecasts of particular macro environmental components, such as population, natural resources, and technology. Examples are IHS Global Insight (a merger of Data Resources and Wharton Econometric Forecasting Associates), Forrester Research, and the Gartner Group. Futurist research firms such as the Institute for the Future, Hudson Institute, and the Futures Group produce speculative scenarios.
All forecasts are built on one of three information bases: what people say, what people do, or what people have done. Using what people say requires surveying buyers’ intentions, composites of sales force opinions, and expert opinion. Building a forecast on what people do means putting the product into a test market to measure buyer response. To use the final basis—what people have done—firms analyze records of past buying behavior or use time-series analysis or statistical demand analysis.
SURVEY OF BUYERS’ INTENTIONS Forecasting is the art of anticipating what buyers are likely to do under a given set of conditions. For major consumer durables such as appliances, research organizations conduct periodic surveys of consumer buying intentions, ask questions like Do you intend to buy an automobile within the next six months?, and put the answers on a purchase probability scale:
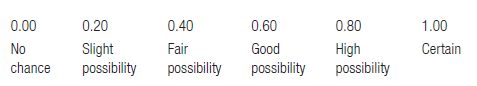
Surveys also inquire into consumers’ present and future personal finances and expectations about the economy. They combine bits of information into a consumer confidence measure (Conference Board) or a consumer sentiment measure (Survey Research Center of the University of Michigan).
For business buying, research firms can carry out buyer-intention surveys for plant, equipment, and materials, usually falling within a 10 percent margin of error. These surveys are useful in estimating demand for industrial products, consumer durables, product purchases where advanced planning is required, and new products. Their value increases to the extent that buyers are few, the cost of reaching them is low, and they have clear intentions they willingly disclose and implement.
COMPOSITE OF SALES FORCE OPINIONS When interviewing buyers is impractical, the company may ask its sales representatives to estimate their future sales. Few companies use these estimates without making some adjustments, however. Sales representatives might be pessimistic or optimistic, they might not know how their company’s marketing plans will influence future sales in their territory, and they might deliberately underestimate demand so the company will set a low sales quota. To encourage better estimating, the company could offer incentives or assistance, such as information about marketing plans or past forecasts compared with actual sales.
Sales force forecasts do yield a number of benefits. Sales reps might have better insight into developing trends than any other group, and forecasting might give them greater confidence in their sales quotas and more incentive to achieve them. A “grassroots” forecasting procedure provides detailed estimates broken down by product, territory, customer, and sales rep.
EXPERT OPINION Companies can also obtain forecasts from experts, including dealers, distributors, suppliers, marketing consultants, and trade associations. Dealer estimates are subject to the same strengths and weaknesses as sales force estimates. Many companies buy economic and industry forecasts from well-known economic-forecasting firms that have more data available and more forecasting expertise.
Occasionally, companies will invite a group of experts to prepare a forecast. The experts exchange views and produce an estimate as a group (group-discussion method) or individually, in which case another analyst might combine the results into a single estimate (pooling of individual estimates). Further rounds of estimating and refining follow (the Delphi method).61
PAST-SALES ANALYSIS Firms can develop sales forecasts on the basis of past sales. Time-series analysis breaks past time series into four components (trend, cycle, seasonal, and erratic) and projects them into the future. Exponential smoothing projects the next period’s sales by combining an average of past sales and the most recent sales, giving more weight to the latter. Statistical demand analysis measures the impact of a set of causal factors (such as income, marketing expenditures, and price) on the sales level. Finally, econometric analysis builds sets of equations that describe a system and statistically derives the different parameters that make up the equations statistically.
MARKET-TEST METHOD When buyers don’t plan their purchases carefully or experts are unavailable or unreliable, a direct-market test can help forecast new-product sales or established product sales in a new distribution channel or territory. (We discuss market testing in detail in Chapter 15.)
Source: Kotler Philip T., Keller Kevin Lane (2015), Marketing Management, Pearson; 15th Edition.
Good web site! I truly love how it is easy on my eyes and the data are well written. I am wondering how I might be notified whenever a new post has been made. I have subscribed to your RSS feed which must do the trick! Have a great day!