Let’s begin by looking at the money that is available within the financial marketplace. Two of the topics we consider, money market funds and margin accounts, measure the amount of funds available within the markets to flow toward additional stock purchases.
1. Money Market Funds
When aggressive investors or traders become nervous about the stock market, they usually sell stocks and place the funds into money market mutual funds. The amount of money market fund assets is, therefore, a potential source of funds for reinvestment into the stock market. Because investors and traders also tend to be wrong at market extremes, the level of money fund assets can be a contrary opinion sentiment indicator.
One method of looking at the relationship between assets in money market funds and the stock market is shown in Figure 10.1. It shows the rate of change of money market mutual fund cash flow. The cash flow often comes from investors in the stock market and increases when they are selling stocks because they are “parking” the money in these short-term funds. The Ned Davis Research, Inc. study shows that a high rate of growth in cash flow to these funds occurs at a time when it is favorable to invest in the stock market. This indicator is thus a sentiment indicator as well as a flow of funds indicator. In the past several years, because short-term interest rates have been so low, money has generally been flowing out of the money market funds, and much of it has entered the stock market hoping for a higher return.
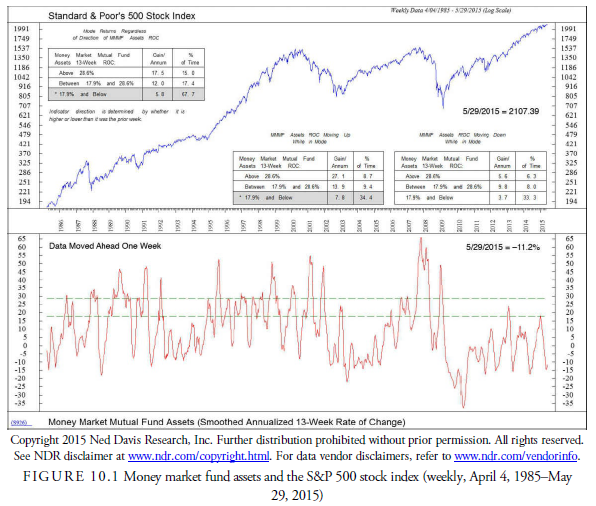
This indicator does not give actual buy and sell signals because it shows only the liquidity or illiquidity available to the stock market. It shows the conditions existing that may have an effect on the stock market but is not a mechanical signal generator. Just because there is money in money market mutual funds does not necessarily imply that the money will eventually flow into the stock market. The indicator states only that such money is available for commitment somewhere, perhaps in the stock market.
2. Margin Debt
Margin debt, the amount of funds that customers at brokerage houses borrow for commitments in stocks, has historically been considered a sentiment indicator. The theory was that when markets became speculative and attracted the less sophisticated and less knowledgeable investors and traders who trade on margin, the market was near a top. Although this relationship might still be partially true, margin debt as an all- encompassing figure of investor debt might have become obsolete. Today’s speculator, instead of borrowing from his brokerage firm, can purchase and sell various highly leveraged derivatives such as options and futures that avoid being reported to the exchanges as margin debt. Thus, the market debt figures may be changing, and certainly an indicator based on them should continually be adjusted.
One way of looking at margin debt is shown in Figure 10.2. It uses a 15-month rate of change as the indicator of margin debt excess. When, over this period, the indicator crosses above -21%, a buy signal is generated, and when it crosses below 48%, a sell signal is generated. Eighteen months after a buy signal, the stock market has advanced on average 45.2%, and on sell signals it has declined an average of 1.7% over the following 18 months. This has worked well in the period from 1970 through 2015, but potential change in the parameters must be considered for the future.

Source: Kirkpatrick II Charles D., Dahlquist Julie R. (2015), Technical Analysis: The Complete Resource for Financial Market Technicians, FT Press; 3rd edition.
7 Jul 2021
7 Jul 2021
8 Jul 2021
7 Jul 2021
7 Jul 2021
7 Jul 2021