Trading ranges (or sideways trends) occur when peaks and troughs appear roughly at similar levels (see Figure 12.3). The peaks cluster at a certain price level, and the troughs cluster at a certain price level below the peaks. The configuration usually occurs after a larger trend has come to a temporary halt. A trading range also is called a consolidation or congestion area or a rectangle formation. Charles Dow called small lateral patterns a line formation, and using it in the Dow Jones Averages had specific rules by which the averages had to abide for that designation. William Hamilton, Dow’s successor editor at the Wall Street Journal, thought the line formation was the only price formation with any predictive power.

1. What Is Support and Resistance?
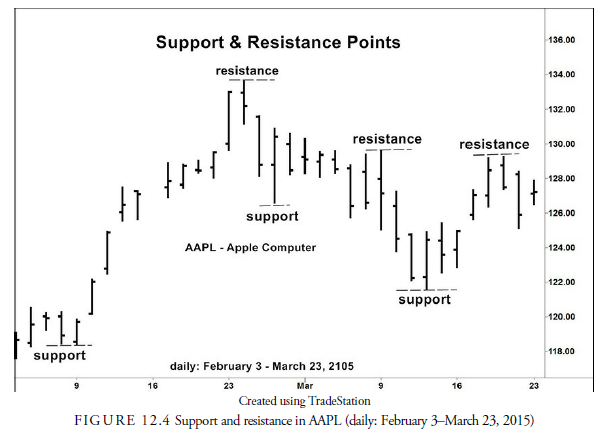
When prices have been rising and then reverse downward, the highest point in the rise, the peak, is referred to as a resistance point, a level at which the advance has met with selling “resistance.” It is the level at which sellers are as powerful and aggressive as the buyers and halt the advance. When the sellers (supply) become more powerful and aggressive than the buyers (demand), the result is a subsequent price decline from the peak. A resistance level becomes a resistance zone when more than one resistance level occurs at roughly the same price. Prices rarely rise and stop at the same level. A single, high-volume price peak often defines a resistance point. Even then, however, because the high volume, especially if it is preceded by a sharp price rise, is a sign of speculation and emotion, and location within the price bar where large sellers actually begin to enter the market is unclear.
A support point is the opposite of a resistance point in that it is a single trough. At the support point, buyers become as powerful or aggressive as the sellers and halt a price decline (see Figure 12.4).
The concept of support and resistance presumes that in the future prices will stop at these recorded levels or zones and that they represent a remembered psychological barrier for prices. The zones will carry through time and become barriers to future price action. Not only will the zones carry through time, but once they are broken through, they will switch functions. Previous support will become resistance, and previous resistance will become support.
2. Why Do Support and Resistance Occur?
Have you ever bought a stock, watched it decline in price, and yearned to sell out for what you paid for it? Have you ever sold a stock, watched it go up after you had sold it, and wished you had the opportunity to buy it again? Well, you are not alone. These are common human reactions, and they show up on the stock charts by creating support and resistance. (Jiler, 1962)
Let us look at the presumed psychology behind a support level and see why it might carry into the future.
There is little question that a price trough is a point at which buyers overwhelmed sellers. In Figure 12.5, AAPL peaked at $133.60 on February 24, a potential resistance level, and then declined touching $121.63 on March 12, at which point it reversed upward but failed to reach the old supply level. Subsequently, the stock price fell back to $122.60 within a dollar of the earlier support on March 26, rallied to $134.54 within $0.86 of the first peak and resistance level, and fell again to the support level and halted at $123.36, only $0.76 from the previous trough. We now have two, well-defined resistance points and three support points: $133.60 and 135.54 resistance points and $121.63, $122.60, and $123.36 support points.

We can assume there are potential buyers between $121.63 and $123.36 because
- In the next sell-off, those who sold short at the $134 level will be covering because they have seen that the price halted its earlier decline at about $122 and do not want to take the risk that it will rally again to $134 and wipe out their profits.
- Those who had been watching the stock but did not buy it at $122 earlier will be satisfied that the decline to $122 is back to where they earlier had wanted to purchase it but “missed it.”
- Those who sold the stock at the low of $122, when it declined from $134.00, saw the price immediately rise thereafter and wish to reenter a position at the price they sold it earlier.
Notice that none of these players is using a fundamental or other informational reason for buying the stock at $122. The reasons are purely psychological, but they are strong reasons by themselves. The presumption for technical analysts is that $122 has now become a support zone and that prices will stop declining at that level in the future. The presumption is that the more frequently prices halt at a zone, the stronger and more important that zone will likely be in the future.
A resistance zone will likely now also exist at $134 for similar reasons because sellers want to sell at that price: sellers who missed $134 before, sellers who bought at $134 and want their money back, and sellers who want to short the stock at $134 where it halted earlier. Support and resistance zones, therefore, are price levels where supply and demand reach equilibrium for unusual but persistent psychological reasons.
3. What About Round Numbers?
Ironically, when prices reach round numbers, the tendency to buy and sell increases. People think in terms of round numbers. Otherwise, why would Walmart sell a shirt for $29.95 rather than $30? They know people subconsciously will associate with the “29” and will believe they are getting a $29 shirt rather than a $30 one. People think in terms of round numbers and act accordingly in the securities markets as well. The current problem with the concept of round numbers is that knowledge of that tendency is widespread. From the standpoint of entering orders then, it is best to determine entry and exit points based on the technical situation rather than worry about round numbers.
4. How Are Important Reversal Points Determined?
The more important the reversal point, the more important the support or resistance level. There are a number of ways to identify a significant reversal point. Let us look at some of them.
In this section, we focus primarily on how to determine significant troughs and support levels. Of course, significant peaks and resistance levels would be determined in the same fashion, only in the opposite direction.
5. DeMark or Williams Method
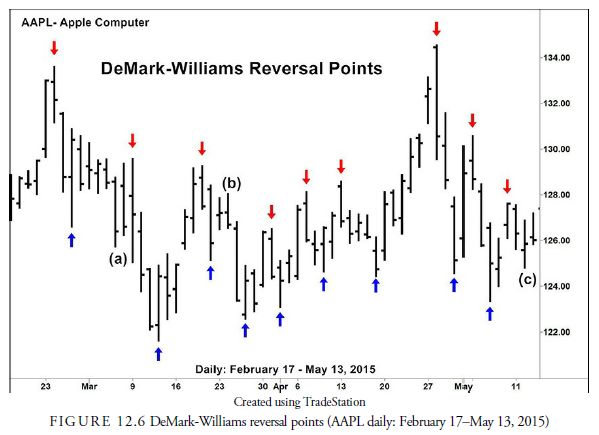
Tom DeMark and Larry Williams each have a method of determining a reversal point by using the number of bars (in a bar chart) on either side of a suspected reversal point. In a low bar, for example, the analyst may look for two bars with higher lows directly on either side of the suspected trough bar. The number of bars on either side can be increased to boost the importance of the trough, but the number of troughs will be sacrificed. The higher the number of confirming lows necessary, the more important but less common the trough.
As an example, look at Figure 12.6. Each of the two-bar lows and highs is marked with an arrow. Point (a) is not a trough because it does not have at least two bars on either side of it with higher lows. Likewise, Point (b) is not a peak. It does not have two bars on either side of it with lower highs. Is Point (c) a trough? We do not know because we can’t see if there are two bars to the right of the low to judge Point (c).
6. Percentage Method
Another method of identifying significant troughs is by deciding beforehand how much the price should decline into and rally from the trough. A percentage is usually used. Using 1%, for example, any time the price declines more than 1%, makes a low, and then rallies more than 1% would define a 1% trough. The larger the percentage used, the more important but less frequent the reversal point.
7. Gann Two-Day Swing Method
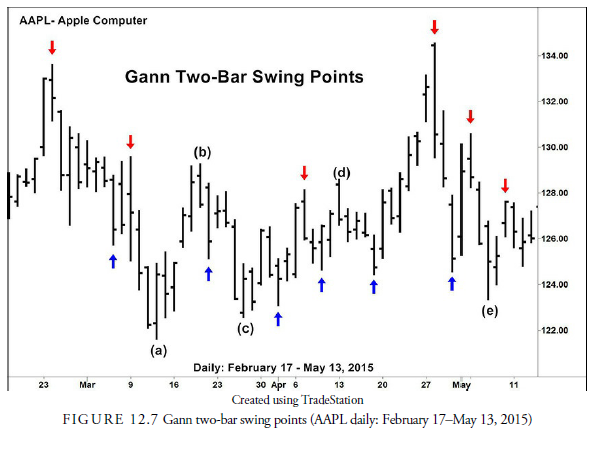
W.D. Gann’s swing method is similar to the DeMark’s or Williams’s method. To find a support point, or trough, a low bar is identified. Once the low bar is identified, the two following trading days are observed. If these two days have higher highs than the low bar, the low bar is a support point. Originally, Gann used the three following trading days to determine a support point, but more recently, it has been switched to two days (Krausz, 1998). Likewise, a resistance point is defined as any high bar during an uptrend that is followed by two successive bars with lower lows. Figure 12.7 is identical to Figure 12.6 except that the reversal points are determined using the Gann rule. The difference between the two charts is that at Point (a), (b), (c), and (d), the reversal points as defined by the Gann rule do not occur at the DeMark/Williams reversal points. The reasons are that the days of the actual reversal points were not followed by the required two successive days. Thus, by Gann’s rule, the reversal may not occur on the actual high or low bar as at (a) and (e) in Figure 12.7.
8. High Volume Method
Very large volume can also identify a significant reversal point. High volume indicates that larger than usual activity occurred on that trading day. Figure 12.8 shows a one-day reversal on high volume at a high, creating a significant reversal point and resistance level.

Figure 12.8 illustrates a one-day reversal. One- or two-day patterns can occur at peaks or troughs. When these occur on high volume, they usually signify important reversal points. Because these formations usually occur at a stage of high emotion, they signify either a panic or a speculative bubble. As such, the actual price level at which the reversal took place is not identifiable on a large bar chart. Sometimes intraday action must be inspected to see at just what price level the majority of buying and selling occurred.
In Figure 12.8, the large spike in volume on April 28, 2015 occurred with a pattern called an outside reversal day, where daily range is large, the high is greater than the previous high, the low is lower than the previous low, and the close is near the low. These patterns can occur without the large volume, but when large volume is present, they are an excellent signal that the price rise has reached a speculative peak and will be a strong resistance in the future.
9. How Are Support and Resistance Zones Drawn?
To construct a support (or resistance) zone, simply draw a horizontal line through each significant trough (or peak) into the future. These lines can be drawn through the respective bar lows or, as Jiler (1962) suggests, using the bar’s close because this is what most investors read in the paper. These lines should also be extended into the past to see if earlier price declines stopped at the same price level. Where these horizontal lines bunch together, sometimes overlapping at the same price level is a support or resistance zone. This zone is usually stronger the more horizontal lines there are within it. In other words, the more times the price level has halted previous advances or supported previous declines, the stronger will be the resistance or support in the future. Because all previous significant troughs have not likely occurred at exactly the same price level, an area called a zone is constructed between the highest and lowest horizontal line. This defines the actual support or resistance area clearly.

FIGURE 12.9 Support and resistance zones (Nasdaq Composite Index (daily: October 7, 2014–March
24, 2015)
If a horizontal line is by itself with no other horizontal lines close to it, it is likely an independent support or resistance line. Such lines, unless accompanied by extraordinary volume, usually do not have the same strength in the future that a combination of horizontal lines might have within a zone.
In the future, prices will tend to halt at these zones, and occasionally at a single line. Prices will often enter the zone but will not break out of the outer horizontal line of the zone. If they do break that level, we have what is called a “breakout” that has important consequences. A price break above the resistance zone implies that sellers are satiated at that level and buyers are anxious. See the upward breakout in Figure 12.9 at the resistance zone in February. In this instance, the break left a vacuum of sellers, and the buyers, at least at that price, controlled the stock. If there is another resistance zone at some distance above the current broken zone, prices will generally trade up to that next higher zone. Thus, a resistance zone in an advancing market can become a price objective once a lower resistance zone is broken. Resistance zones exist at all horizons—day, week, or even minute-to-minute. Some traders only trade stocks or futures—especially e-mini futures— between these zones often on an intraday basis between very short-term support and resistance zones.
What we have said about resistance zones is equally applicable to support zones. Horizontal lines at significant troughs will show the existence of these zones, and extended into the future, they will become zones of support to price decline. In Figure 12.9, for example, the previous resistance zone became a support zone at Point X when the correction after the upward breakout halted at that same level. In addition, as time goes on, the importance of past horizontal lines diminishes for both support and resistance zones. More recent price reversals are more important. Human memory fades quickly.
10. How Do Analysts Use Trading Ranges?
Getting back to our earlier introduction of sideways trends, a trading range, as shown in Figure 12.9, is a price level where both support and resistance zones are relatively close together, and prices “bounce” between them until finally breaking out in one or the other direction. Some traders will trade the “bounces” between support and resistance, but this is usually dangerous and requires low operating costs and constant attention (Schwager, 1996). The most profitable and reliable way to use the trading range is to practice “breakout” trading. Let us look at each of these strategies a little more closely.
11. Range Trading
Trading within a range is difficult. Although many books suggest it as a strategy, it is almost impossible for the nonprofessional to profit through range trading. First, it is difficult to recognize that prices are trading in a range until after a considerable amount of trading and time has passed. It is, therefore, largely in retrospect that the opportunities are recognized. In addition, operating costs, such as commissions and slippage, must be small and execution efficient, or else any potential profit will be overwhelmed by transactions costs. Because the bounds of a trading range are often zones rather than specific price levels, the point at which an execution order, either buy or sell, should be placed is indefinite. Finally, the location for a protective stop-loss order to prevent a breakout from ruining trading profits is difficult to determine. By the time all these costs and execution levels are recognized, the potential for profit has diminished considerably, making any profit versus risk unlikely. Thus, most traders stay away from trading within a trading range and instead wait for the inevitable breakout and beginning of a trend.
The one exception to range trading is channel trading. A channel is a trading range tipped at an angle such that it trends upward or downward. Trend lines define the bounds of the channel just as support and resistance lines define the trading range. One can trade these channels back and forth but only in the direction of the channel trend. In other words, if the channel is trending upward, only long positions are taken at the lower bounds and sold at the upper bounds, but no short position is taken contrary to the channel trend. As mentioned earlier, upward trends have longer upward subtrends and shorter downward subtrends. To a certain extent, depending on the slope of the channel trend, the subtrends in the direction of the trend reduce the difficulty seen in trading ranges.
12. Breakout T rading
Breakout trading is as old as technical analysis and likely the most successful. Remember that a trading range is somewhat like a battleground, where the buyers and sellers are warring for dominance. Most chart patterns are combinations of trend lines and, thus, are battlegrounds also. Before the battle is over, it is almost impossible to determine who will win. It is usually wiser, and more profitable, to wait rather than to guess. Once, however, prices break out of the trading range, the investor has information about who has won the war. If the breakout is to the upside, buyers are driving price up; if the breakout occurs to the downside, sellers are overwhelming buyers. Trading on this breakout is probably the most profitable and reliable strategy for the investor faced with a trading range or pattern.
Breakout trading can be used in many different ways other than for just trading ranges. One of the most famous is the Donchian breakout method, also called the “four-week breakout system,” originated by Richard Donchian and later improved upon by Richard Dennis. It still appears to work. A recent study by Active Trader Magazine (Kurczek and Knapp, 2003) indicates that even though the method is popular and has been widely known for many years, it still produces profits, especially in the commodities futures markets. Its calculation is absurdly simple. Buy when the highest high over the past four weeks is broken, and sell when the lowest low over the past four weeks is broken. A “stop-and-reverse” strategy requires a position, long or short, at all times.
A breakout is a powerful signal. It indicates that the balance between demand and supply has been settled, usually violently, and, thus, is an indication of the initiation or continuation of a directional trend. The subject of how to assess breakouts is covered in the next chapter.
Source: Kirkpatrick II Charles D., Dahlquist Julie R. (2015), Technical Analysis: The Complete Resource for Financial Market Technicians, FT Press; 3rd edition.
8 Jul 2021
8 Jul 2021
8 Jul 2021
7 Jul 2021
7 Jul 2021
7 Jul 2021