Breadth indicators assess market strength by counting the number of stocks that traded up or down on a particular day. An alternative way to gauge market internals is to measure the up volume and down volume. Up volume is the volume traded in all advancing stocks, and down volume is the total volume traded in declining stocks. Up and down volume figures are reported in most financial media.
Considering the volume, rather than only the number of shares traded, places more emphasis on stocks that are actively trading. With the breadth indicators, a stock that moves up on very light trading is given equal importance to one that moves up on heavy trading. By adding volume measures, the lightly traded stock does not have as much influence on the indicator as a heavily traded stock. The one caveat with using volume is that occasionally an enormous trade in a low-priced stock will upset the daily figures. This happened on December 9, 2009, when 3.76 billion Citigroup shares traded. The up and down volume statistics for that day were useless. Finally, the use of dark pools, off-exchange trading, and other methods of avoiding the reporting of transactions as well as the increase in trading in stocks that are part of ETFs and index futures have upset the earlier balance between volume and the individual investor. Many stocks are traded today as commodities in an index, for example, not because they are worthwhile investments but only because they are in the index. Volume as a statistic has, thus, become another aspect of change in the marketplace, and its use for technical indicators is changing and should be approached with caution.
1. The Arms Index
One of the most popular up and down volume indicators is the Arms Index, created by Richard W. Arms, Jr. (winner of the MTA 1995 Annual Award). The Arms Index (Arms, 1989), also known by its quote machine symbols of TRIN and MKDS, is reported daily in the financial media.
The Arms Index measures the relative volume in advancing stocks versus declining stocks. When a large amount of volume in declining stock occurs, the market is likely at or close to a bottom. Conversely, heavy volume in advancing stocks is usually healthy for the market. The Arms Index is actually a ratio of two ratios, as follows:

The numerator is the ratio of the advances to declines, and the denominator is the ratio of the up volume to the down volume. If the absolute number of advancing shares increases on low volume, the ratio will rise.
This higher level of the Arms Index would indicate that, although the number of shares advancing is rising, the market is not strong because there is relatively low volume to support the price increases. This ratio, thus, travels inversely to market prices (unless plotted inversely), tending to peak at market bottoms and bottom at market peaks. This inverse relationship can initially be confusing to the chart reader.
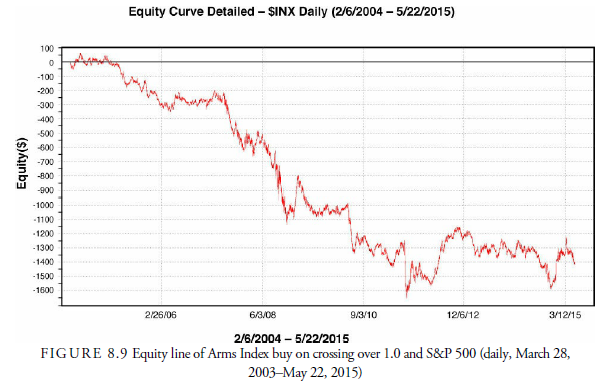
Similar to breadth ratios, the Arms Index can be smoothed using moving averages and tested for parameters at which positions can be entered. An Arms Index greater than 1.0 is considered to be a bearish signal, with lower levels of the index indicating a more favorable market outlook. In our experiments, however, for the period February 2003 through May 22, 2015, we found that when the Arms Index rose above 1.0, it was a short-term buy signal rather than the expected sell signal. The equity curve is shown in Figure 8.9. Note that profits declined right from the beginning and never recovered. This is not the way to use the Arms Index.

Colby (2003) introduced a number of models that showed promise until the year 2000. A long-standing panic signal, devised by Alphier and Kuhn (1987), is to buy the stock market when the Arms Index exceeds 2.65 and hold it for a year. It basically worked well until 2009 when it had a 46% drawdown. It recovered from that in 2011 and went on to profit, but such a drawdown is unacceptable to most investors and a warning of what might occur in the future. When we shortened the holding period rather than using the original 252 days, the performance of the signals improved, but the large drawdown in 2009 remained.
2. Volume Thrust with Up Volume and Down Volume

Using up volume and down volume only and forming an oscillator that is a moving average of the ratio of one to another produces an oscillator that has an excellent history of producing profitable thrusts, especially on the Nasdaq. Shown is a chart (Figure 8.10) that represents the specific method devised by Ned Davis Research, Inc. It is a ratio of the 10-day up volume to the 10-day down volume with thresholds at 1.48, above which is a thrust buy, and 1.00, below which is a sell. The performance is measured by the prospects for the market when the ratio is in one of three ranges. Above 1.48, the Nasdaq advanced for an annualized gain of 38.9%; between 1.48 and 1.00, the annualized gain declined to a positive 12.9%; and below 1.00, it produced a loss of 7.4% annualized.
3. Ninety Percent Downside Days (NPDD)
Paul F. Desmond, in his Charles H. Dow Award paper (Desmond, 2002), presents a reliable method for identifying major stock market bottoms that uses daily upside and downside volume as well as daily points gained and points lost. The volume figures are reported in the financial media, as are the stock tables. Unfortunately, the sum of points gained and lost is not reported publicly and requires considerable handwork or a computer. A 90% downside day occurs when, on a particular day, the percentage of downside volume exceeds the total of upside and downside volume by 90% and the percentage of downside points exceeds the total of gained points and lost points by 90%. A 90% upside day occurs when both the upside volume and the points gained are 90% of their respective totals. What he found was that
- An NPDD in isolation is only a warning of potential danger ahead, suggesting, “Investors are in a mood to panic” (Desmond, 2002, p. 38).
- An NPDD occurring right after a new market high or on a surprise negative news announcement is usually associated with a short-term correction.
- When two or more NPDDs occur, so do additional NPDDs, often 30 trading days or more apart.
- Big volume rally periods of two to seven days often follow an NPDD and can be profitable for agile traders but not for investors.
- A major reversal is signaled when an NPDD is followed by a 90% upside day or two 80% upside days back-to-back.
- In half the cases, the upside reversal occurred within five trading days of the low. The longer it takes for the upside day reversal, the more skeptical the investor should be.
- Investors should be careful when only one of the two upside components reaches 90%. Such rallies are usually short.
- Back-to-back 90% upside days are relatively rare but usually are long-term bullish.
4. 10-to-1 Up Volume Days and 9-to-1 Down Volume Days
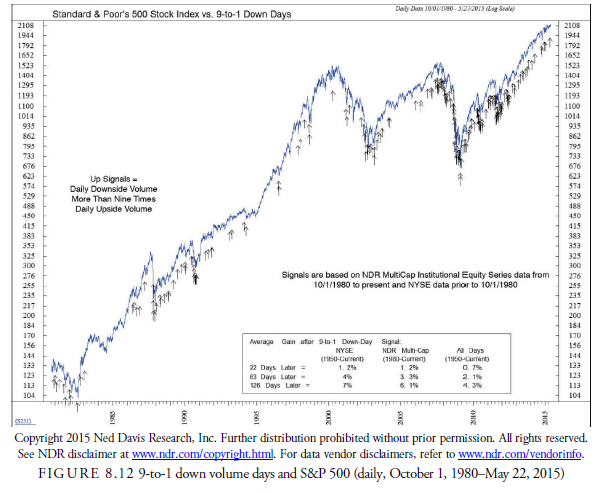
Whereas Desmond combines breadth and volume for his panic indicator, Ned Davis Research, Inc. studied up and down volume alone without confirmation from breadth. Ned Davis Research, Inc.’s rules are a little complicated, a sign that the analyst should beware. Complicated rules are usually those that are constructed from curve fitting and might not be viable in the future because they only fit past data. However, the results of these studies were impressive and demonstrated the contrary opinion thesis that panics are often times to buy and sharp, steep rises from lows especially often signal the end of a decline.
Specifically what they found was that roughly six months after a 10-to-1 up volume day, the market was 9% higher (see Figure 8.11). Similarly, after roughly six months following a 9-to-1 down volume day, the market was 6% higher (see Figure 8.12). Shorter periods after each signal were also higher but not by the same percentage. In other words, each of these events suggested a panic bottom.


Source: Kirkpatrick II Charles D., Dahlquist Julie R. (2015), Technical Analysis: The Complete Resource for Financial Market Technicians, FT Press; 3rd edition.

7 Jul 2021
7 Jul 2021
7 Jul 2021
8 Jul 2021
7 Jul 2021
8 Jul 2021