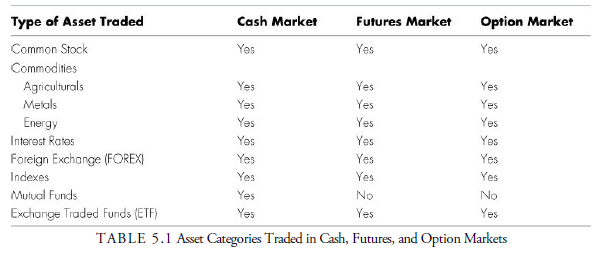
Now let us look at categorizing markets by the type of contract that is executed. Two broad contract categories are the cash market and the derivative market. The futures market and the option market are subcategories of the derivative market. Table 5.1 shows the types of assets that might be bought and sold in the cash, futures, and option markets.
1. Cash Market
The cash, or spot, market is the oldest type of market. In the cash market, a contract is entered into that will result in immediate exchange of the agreed-upon items. Different rules and conventions regarding the meaning of “immediate” apply depending upon the type of asset being traded. For example, when foreign currencies are being exchanged, delivery is usually instantaneous or at least within two days. In the case of common stock, the delivery period is three days. In the case of cash commodities, each market has its own rules and conventions. Cash indexes trade almost exactly like common stocks, and their delivery is regulated by the exchanges upon which they are traded.
The stock market, the most widely recognized cash market, is open to the public. In the cash commodities markets, the prime producers or consumers of the commodity traded often dominate. For example, Nestle is a large participant in the cocoa cash market; Exxon is a major participant in the oil cash market; Citibank is a major participant in the financial cash market (bonds, notes, fed funds, and so on); and UBS is a principal participant in the FOREX (foreign exchange) cash market.
As technical analysts, the cash markets in which we are principally interested are the common stock and index cash markets that are available on the public stock exchanges. Cash markets can be leveraged, but not usually as much as the other vehicles. The amount of leverage in the stock market, as well as the option market, is controlled by the Federal Reserve and the Securities and Exchange Commission, but various ways of getting around the regulations have been developed through the use of derivative markets and private arrangements with lenders. Nevertheless, the average trader or investor is bound by the Federal Reserve regulations, which presently require that for stocks and indexes, a minimum of 50% of market value must be in cash for overnight positions and 25% for intraday positions. This means that the trader or investor can have a 2-to-1 margin for overnight holdings and a 4-to-1 margin for pattern trades intraday. For each $1, up to $2 in securities can be purchased or sold short overnight, and $4 in securities can be held within the day. There are different rules for day traders, for holders of U.S. Treasury securities, for market makers, and for shares selling under $5, and the various exchanges and brokerage firms can have tighter margin requirements if they want. Before contemplating the use of margin, the investor or trader should inquire at the intended brokerage firm what rules and regulations would be applicable to the trading or investing style desired.
Liquidity in the cash stock markets is excellent. The volume of trades and amount of money transacted each day suggest that willing buyers and sellers can always be found. The only time that the U.S. exchanges adjust trading or close down is when the exchange’s computers go down, when a major event or severe weather affecting the United States occurs, or when the stock averages rise or decline a certain large amount, say in a panic. In the instance of a large price change, the NYSE pauses trading, giving investors time to assimilate incoming information. When predetermined limits, called circuit breakers, based on a percentage change in the S&P 500 are reached, the exchange closes down all trading for a limited time. As of June 2015, should the S&P 500 decline more than 7% in a day before 3:25 p.m. EST, a Level 1 breaker would occur and the exchange would close for 15 minutes. Should the S&P 500 drop 13% after 9:30 a.m. and before 3:25 p.m. EST, a Level 2 breaker would occur and the exchange would again close for 15 minutes. Should a 20% drop in the S&P 500 occur at any point during the day, a Level 3 breaker would be triggered and the exchange would halt trading for the remainder of the day.
Since market-wide circuit breakers were put in place in 1988, a shutdown has only been triggered once, on October 27, 1997, when the Dow Jones Industrial Average declined 550 points by 3:30 p.m. At that time, the circuit breakers were triggered when the Dow fell by 10%, 20%, and 30% of the previous quarter’s level. In 2012, the circuit breakers were tightened to be more effective in today’s high-speed markets. Had these tighter circuit breakers been in place, the 7% breaker would have been triggered 13 times since 1962.
Box 5.2 Exchange-Traded Fund (ETF)
In the past 20 years, a security called an exchange-traded fund (ETF) that replicates an index fund or a basket of assets has become extremely popular as a trading and a hedging vehicle.
History—A failed attempt to create a similar investment vehicle in 1989 at the American Stock Exchange and the Philadelphia Stock Exchange was the first ETF-type security. It intended to simulate the S&P 500. A year later, the Toronto Stock Exchange successfully introduced freely traded index funds of Canadian stocks, emulating the Toronto Stock Exchange 35 and 100 averages.
Nathan Most (who died in December 2004 at the age of 90), an executive of the American Stock Exchange, seeing the success of the funds in Toronto, created in 1993 the first such fund to replicate the Standard & Poor’s 500 Index. It was a Standard & Poor’s Depository Receipt (SPDR), and the ticker symbol was SPY. Consequently, it earned the nickname “Spyder” that is now seen on the TV ads. It is the most traded ETF, even today.
Structure—ETFs hold assets, similar to a mutual fund. Ordinarily, large institutional dealers buy and sell shares directly from the ETFs in exchange for large blocks of the underlying assets in the fund. These dealers then become market makers in these ETF shares and trade them on the exchanges similarly to common stocks. Because the shares are backed by the underlying assets, arbitrage keeps their value close to the price of the underlying assets. From the retail standpoint, the ETF is then equivalent to a mutual fund with liquidity. The difference between them and mutual funds is that they trade all day, can be bought or sold at any time during the day, and unlike closed-end funds, trade with only a very small discount. (The Wall Street Journal, November 2008, reported an average deviation of 1% during the market turbulence of that time, and as high as 10% in some thinly traded issues.) As retail demand for the ETF increases, a small temporary premium develops that incites the dealers to exchange more assets for the ETF shares. The constant arbitrage between the assets prices and the ETF price keeps the two generally in parity.
The largest ETF with the most trading volume is still the Spyder, but numerous others have come on the market. Close behind are the QQQQs (the “Cubes”), replicating the Nasdaq 100, and the DIAs (“Diamonds”), replicating the Dow Jones Industrial Average.
Advantages—In most cases, ETFs distribute dividends (or reinvest them), thus eliminating the dividend spread seen in the index futures and options markets; they are taxed like stocks; and they do not require an uptick to be sold short. They have a lower expense ratio than mutual funds and do not have load fees, redemption fees, or short-term trading fees. The cost of transacting them is a normal brokerage fee just as if they were stocks. Capital gains are payable upon sale of the ETF, unlike with mutual funds where a capital gain can be incurred during the ownership period. Finally, ETFs, by their nature, are transparent. You, as the investor, know exactly what assets the ETF holds, unlike a mutual fund that may buy and sell assets between reporting periods.
Styles—Replication of stock market indexes is the most common form of ETF. Next in popularity are commodities ETFs (and a variant called Exchange Traded Commodities). These invest in commodities such as precious metals, energy, and agriculturals. There are hidden dangers in holding these investment vehicles because their underlying (discussed in the next section) is often a position in the futures markets and are rolled forward with each expiration, causing a “cost to roll” above the value of the underlying commodity. Finally, there are three other important styles: U.S. government bond funds, currency funds, and actively managed funds.
Leverage—ETFs can be leveraged just as if they were common stocks under the Federal Reserve margin regulations. However, in the past few years, leveraged funds appeared that promise to double or triple daily returns both upward and downward (called inverse funds). The speculator can now leverage a position beyond the margin requirements but at the same time also expose a position to larger risk of capital loss. These leveraged funds incur additional costs during volatile markets because they are backed by various derivative positions that are bought and sold continually to balance the underlying portfolio risk.
2. Derivative Markets
The term derivative describes a financial contract that “derives” its value from some other investment vehicle, often called the underlying. The primary use for derivatives is to hedge against risk of loss in the underlying or to speculate with high leverage. Aside from the risk of loss from the hedge or speculation decreasing in value, both hedging and speculation take on additional risks such as counterparty risk, the risk that the party on the other side of the derivative contract may fail to deliver. However, most derivatives have not had this problem and are used principally to transfer risk between investing parties. In this sense, derivatives are thought to cushion economic downturns. In specific instances, however, the derivative market increased volatility, as occurred during the “insurance programs” in 1987, when equity portfolio managers to protect against losses in their portfolios sold S&P 500 futures as the market declined and thus contributed further to the market decline that turned into a crash in prices never seen before.
The most common derivatives are futures, options, and swaps, traded either on exchanges, where their prices are visible, or over the counter, where their prices are hidden. The principal underlying vehicles are commodities, equities, FOREX, interest rates, and credit markets.
3. Futures Markets
Futures contracts that are traded in the futures markets are contracts in which the buyer and seller agree to trade at specific terms at a specific future date. Futures markets are often incorrectly called commodity markets more from historical usage than as a realistic description. Futures markets first developed in the agricultural markets as forward contracts, mostly in the grain markets, to provide a hedge for farmers and banks against crop failure or surplus. To understand the development of the futures market, suppose that you are a wheat farmer. You are concerned about the market price of wheat at harvest time. If the price is not as high as you anticipated because of a bumper crop of wheat, your profits will suffer. American Bread Company (ABC) is also concerned about the price of wheat, although ABC’s concern is the opposite of yours. ABC’s fear is that a poor wheat crop will lead to rising wheat prices, which translates into higher input costs and lower profits for ABC. You and ABC can ease your concerns by entering into a forward contract. In this forward contract, you would agree to sell a particular amount of wheat to ABC at a particular future date and at a price you set now. This reduces your risk and ABC’s risk, gives you an idea of what to expect as far as your income, and locks in the price of ABC’s input.
Although individuals wrote forward contracts for many years, the contracts were first traded in the United States on the Chicago Board of Trade (CBOT) in 1848. However, the trading was cumbersome because the contracts were nonstandard: they each had different delivery dates and different commodity quality specifications. To address this issue, the CBOT developed the standardized contracts we know today as “futures contracts” in 1865 (Brecht, 2003).
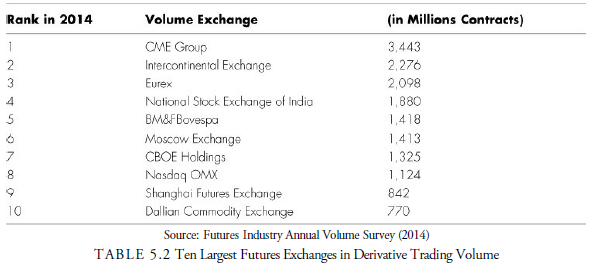
The CBOT, often referred to as “The Board of Trade,” is the oldest futures exchange in North America. Ironically, the largest is the Chicago Mercantile Exchange (CME Group), often called the “Merc,” that now owns the CBOT, COMEX, and NYMEX. Today, there are a number of futures exchanges throughout the world, many specializing in contracts of specific underlying assets. Futures exchanges are becoming a minigrowth industry as developing nations are organizing markets to trade especially in local products. As Table 5.2 demonstrates, some of the largest futures exchanges are outside of North America.
Futures, unlike stocks, are contracts that represent an agreement to purchase or sell a specific amount and quality of asset at the expiration date. Most nonfinancial contracts are either closed in the marketplace by selling or buying before their first delivery day or are “delivered.” For example, if you own one contract in sugar and do not sell it before the delivery day, you are obligated legally to accept delivery of several railroad boxcar loads of sugar at your railhead. Major dealers in these commodities have the facilities to take or make delivery; most speculators do not. When a trader buys a futures contract then, he does not own anything other than an obligation to take delivery on the delivery day of the commodity underlying the contract. Because the contract is not a specific title of ownership, it is never executed until the delivery day. It is traded back and forth between buyers and sellers, similar to the way musical chairs are played, only the music stops on delivery day. Financial futures contracts are different from commodity futures contracts in that they settle on delivery day with cash based on the closing prices of the underlying securities or index.
When a position is initiated in a futures contract, the brokerage firm requires a good faith deposit that requires the trader to make good on any fluctuation in the contract price value. As the price of the contract rises and declines, the good faith deposit is increased or decreased by the amount of the price value change. When the deposit declines below a certain level, the brokerage firm requires that more funds be added to the account. Otherwise, the brokerage firm closes the position.
Margin requirements change as the price of the contract changes, as the price level or volatility changes, or if the exchange determines that the price may change significantly. Exchanges determine the minimum requirements for their contracts, and brokers may set rates higher but not lower than the exchange requirements. There are two types of margin—initial and maintenance. Initial is the amount necessary in the account before an order can be placed. Maintenance margin is the minimum amount necessary to keep an account active. This margin changes each day with the movement of the contract price.
Futures contracts trade in a series of contract months, and each is a unique contract group. The May 2016 Heating Oil futures are different from the June 2016 Heating Oil futures. They are substitutable for their specific contract months but not for each other. On a futures contract, the expiration day, the specific description of the underlying, and the contract size are constants while the price fluctuates. Financial futures are the same in this respect. Their expiration months are quarterly (March, June, September, and December) for each year.
The advantages of futures relative to stocks are many. Futures do not require an uptick for short selling; they are highly leveraged; they have a favorable tax benefit. Any futures trade is automatically allocated 60% to long-term gain/loss and 40% to short-term gain/loss. Furthermore, at year-end, the brokerage firm sends only one piece of paper with the net gain or loss for the year rather than a wheelbarrow full of transaction tickets needed to fill out the IRS Schedule D.
The danger of futures centers on its leverage and, in some instances, its illiquidity. Counterparty risk is alleviated through guarantees enforced by the exchanges on all participating parities. The margin requirement for most futures contracts is less than 10%. It is not required that futures traders use all their margin. Indeed, prudent money management would suggest otherwise, but the danger of trading without protective stops (see Chapters 13, “Breakouts, Stops, and Retracements,” 22, “System Design and Testing,” and 23, “Money and Portfolio Risk Management,” for usage of stop orders) and a reasonable money management method (see Chapter 23) has been the ruination of many traders. The other major danger is in more illiquid futures markets where what is called a limit day occurs. Some futures have daily range limits. This practice has declined over the past few years to the point at which some futures have limits only for contracts older than the spot month. Nevertheless, a daily price limit, when applicable, means that once the daily range limit from open to high or low is reached, trading in that contract is shut down. If one has a stop order that was not executed when the range was exceeded and the market shut down, too bad. Sometimes several range or daily limit days occur in a row and no trading takes place at all. On a highly leveraged position on the wrong side of the market, this can be ruinous. In the liquid markets such as the financial markets, a limit day is rarely seen because the liquidity of the market is so strong. Nevertheless, a limit day is a risk to be considered.
Box 5.3 Concurrent Expiration of Option and Futures Contracts
One cross-vehicle effect that can influence price action in all three market vehicles in the stock market especially is the expiration of option and futures contracts. On each concurrent expiration date or shortly before, the prices of all three vehicles can be affected by the crosscurrents between each vehicle expiring and its underlying security. This is even more complicated when the underlying security is itself a derivative. For example, options on index futures expire on the same day and are priced at the same time. Depending on the number of options being exercised on that day and the number of futures also coming due that day, the markets in the underlying can become hectic. From the viewpoint of the technical analyst, almost none of the price action from such expiration activity has any meaning for the future of the underlying prices. Nevertheless, limit and stop orders can sometimes be triggered, causing necessary adjustments in a portfolio.
4. Option Markets
An option contract gives the holder the right, but not the obligation, to complete the transaction stated in the contract before the expiration date of the contract. There are two basic types of options—call options and put options. The buyer of a call option has the option to buy an asset at a particular price, known as the s tr ik e p r ic e , before the option expiration date. The buyer of a put option has the right to sell the stated asset at the strike price before the option expiration date. Of course, for every buyer of an option, there must be a seller; the seller has the obligation to transact should the buyer choose to use his option. When the owner of an option chooses to use the option, buying the underlying asset if it is a call option and selling the underlying asset if it is a put option, he is said to exercise his option. Options contracts come in a standard size, giving the holder the right to transact 100 shares. Some mini contracts (for 10 shares) and jumbo contracts (for 1000 shares) exist, but they are rare and highly illiquid.
An option can be in-the-money (ITM), at-the-money (ATM), or out-of-the-money (OTM) depending on what the price of the underlying security is in the cash market relative to the strike price of the option. A call option is in-the-money when the stock price is above the strike price and out-of-the-money when the stock price is below the strike price. The opposite is true for a put option. In-the-money puts have a strike price above the current stock price, out-of-the-money puts have a strike price below the current stock price.
Two broad groups purchase options: speculators and hedgers. Suppose, for example, MSFT is currently trading at $45 a share. A trader who is expecting MSFT to rise rapidly might buy a call option with a strike price of $45.50. If the trader is correct, he will be able to exercise his option, purchasing MSFT at $45.50 and selling those shares for a profit in the cash market. Thus, the speculator is betting on a price move. Hedgers use options to protect a profit or to protect against a loss. If a trader purchased MSFT at $35 and the price has risen to $45, he has made a $10 a share profit. If he thinks MSFT is in an uptrend and wants to hold on to his position for the possibility of an even higher profit, he can purchase a $44.50 put option, which will guarantee that he can sell MSFT for at least $44.50 if his analysis is wrong and the trend reverses, causing MSFT’s price to drop in the cash market. Thus, he is able to lock in a good portion of his profit while maintaining upside potential by holding a put option as a kind of insurance.
Technical analysis is useful in the cash and futures vehicles but not so much in the options markets. Option markets usually have a short life span and, with certain exceptions, such as the index options, less liquidity than the other vehicles. A trader can expose himself to a price move by spending a few dollars to purchase a call option to buy 100 shares of the underlying security rather than purchasing 100 shares of the security and tying up a large amount of capital. Although this is often touted as an advantage of options, it also means that a trader can be exposed to a great deal of leverage. The sizable leverage risk is extremely dangerous for the novice.
Because options are derivatives of the cash or futures markets (the “underlying” markets), often these underlying markets are analyzed first and then trading rules are applied to the options markets. For example, in the S&P 500 futures, a technical buy signal may be generated, and the trader, instead of acting on the future, will buy the call, sell the put, or create some kind of combination of calls and puts.
Options are a subject all their own and are not covered in this book. Because options are derivatives of other vehicles, the student should well understand the cash and futures market before studying or entering the options markets.
Most options trade on exchanges. However, there are esoteric options that trade over the counter in an invisible market between large institutions. These options include the credit default options (CDO) that caused so many problems in the recent financial breakdown. These markets are not freely traded, nor are prices readily available for technical analysis. Within institutions that trade such vehicles, prices may be available for study, but for the public they are not.
5. Swaps and Forwards
Swaps and forwards are traded over the counter, not on exchanges where prices are continuous and visible. Often, these contracts are specific to the parties only, not transferable, not freely traded, and do not have continuous prices. For these reasons, technical analysis is impossible. Swaps are contracts between parties agreeing to swap certain investment vehicles (one interest rate vehicle for another, for example). Forwards are swap agreements to swap similar investment vehicles sometime in the future. Repurchase agreements, for example, in which one agrees to sell and then repurchase Treasury bills, are forward swaps. Technical analysis is inapplicable to most of these contracts because they are not freely traded or substitutable with continuous prices. Indeed, in many cases, these contracts cannot be valued.
Box 5.4 The Foreign Exchange Market
The foreign exchange market, often referred to as FOREX, is the market where currencies are traded. According to the Bank for International Settlements, trading in foreign exchange markets averaged $5.3 trillion per day in April 2013, making it the largest financial market in the world (www.bis.org). The trading of currencies does not occur at a centralized exchange location; rather, it takes place through an electronic over-the-counter market. Trading occurs in major finance centers around the world; as the trading day in one part of the world ends, the trading day in another part of the world is just beginning, resulting in a 24-hour market.
Obviously, the foreign exchange market is necessary to support international trade. Companies wanting to buy from or sell to companies located in other countries must convert currencies as do international travelers. The sheer size of the FOREX market, however, suggests that these participants play a minor role. Consider that the World Bank estimates that Gross World Product (the summation of the Gross Domestic Products of all countries) was $75.59 trillion in 2013 (www.worldbank.org). Even if all the world’s production was being sold internationally, it would take less than 15 days of FOREX volume to convert currencies for a year’s worth of international trade. Obviously, much currency trading is speculative in nature. Almost 40% of the daily FOREX activity is trading between currency dealers. Other financial institutions, such as hedge funds, proprietary trading funds, nondealer banks, and investment companies, account for over half of the daily currency trading. Although central banks actively participate in the currency markets as they implement their policies, they account for only about 1% of the daily turnover in the FOREX market.
A FOREX trade is composed of a currency pair, in which one currency is being traded for, or converted to, the second currency. In 87% of FOREX transactions, the U.S. dollar is one of the two currencies. Almost one-quarter of all FOREX trade is in the U.S. dollar/euro pair. The U.S. dollar/Japanese yen and the U.S. dollar/British pound account for 18% and 9% of the market, respectively. The most common non-U.S. dollar pair is the euro/Japanese pair, which accounts for less than 3% of the trading (www.bis.org).
A number of academic studies have not only documented the prevalence of technical analysis in the FOREX market but have suggested that technical strategies can be profitable when trading currencies. Some of these studies include the following:
-
- Chang, P.H. Kevin, and Carol Osler, 1999, “Methodical Madness: Technical Analysis and the Irrationality of Exchange-Rate Forecasts,” Economic Journal 109, 636-661.
- LeBaron, Blake, 1999, “Technical Trading Rule Profitability and Foreign Exchange Intervention.” Journal of International Economics 49, 125-143.
- Neely, Christopher J., and Paul A. Weller, 2003, “Intraday Technical Trading in the Foreign Exchange Market,” Journal of International Money and Finance 22, 223237.
- Osler, Carol L., and Kevin P. H. Chang, 1995, “Head and Shoulders: Not Just a Flaky Pattern,” Federal Reserve Bank of New York Staff Report No. 4.
Source: Kirkpatrick II Charles D., Dahlquist Julie R. (2015), Technical Analysis: The Complete Resource for Financial Market Technicians, FT Press; 3rd edition.
I conceive you have mentioned some very interesting details, regards for the post.