A top in the market is the point of maximum optimism, and a bottom in the market is the point of maximum pessimism. (Davis, 2003, p. 9)
Sentiment indicators are data series that give the technical analyst some feeling for how much prices are at an excessively emotional level. With that information, potential future reversals in trend can be better anticipated. Generally, sentiment indicators are more useful in analyzing markets than individual issues.
Individual issue prices have their emotional component, of course, but ways to measure that component are much less reliable than those of measuring overall market sentiment. Therefore, we focus our discussion on indicators that reflect overall market optimism.
Remember, we are interested in the two broad categories of players—the uninformed and the informed. Most sentiment indicators focus on the uninformed. These uninformed players are usually wrong at major market turns. Therefore, if we know what the uninformed are doing, we have a clue about what not to do. On the other hand, some sentiment indicators attempt to measure the action of informed players, who generally are accurate in their assessment of market prospects. These indicators are based on watching professional traders and corporate insiders and following their lead.
Fear and greed are not mirror images of one another. Emotional excess is often the sharpest at market bottoms when panic has occurred. On the other hand, optimism can last for a long while. Most sentiment indicators are, therefore, useful in determining market bottoms when the fear reaches its highest level. These indicators can often be deceiving on the rise in prices, however, because the greed gradually builds upon itself during a price rise. A sell signal generated by a specific sentiment indicator is, thus, likely to be premature and not as valid as a buy signal.
1. Sentiment Indicators Based on Options and Volatility
To glean some information about what uninformed traders are doing, analysts often consider option trading activity and volatility measures. Option trading can be a sign of market speculation, and volatility can be an indication of the anxiousness of market players. Let’s look at some of these measures.
2. Option Trading and Sentiment
Traditionally, odd lot statistics were reliable indicators of the sentiment of uninformed, small investors. That small investors, who did not have enough capital to purchase round, 100-share lots, traditionally called odd lots, were heavily buying stocks was an indication that the uninformed public was overly optimistic. When small, uninformed investors were highly pessimistic, they would short sell odd lots. The odd lot figures represented a measure of uninformed, public speculation, which tended to be highest at market turning points.
Today, listed options data has replaced the old odd-lot figures as one of the best measures of public speculation. A call option is an option to buy an asset, usually a stock or commodity, at a fixed price for a specific period. A put option is an option to sell an asset at a fixed price for a specific period of time. Some options, by expanding on the basics of time and price, can become complex. However, the standard call and put option is the most widely traded and has the highest volume of any option type. The option market, by its very nature, is speculative. It depends on leverage for maximum gains, and positions can close worthless on the expiration of options. As such, it has become a speculative vehicle for the uninformed public.
Let us look at how the options market can measure sentiment. Let us assume that Jerry thinks that the price of stock XYZ will increase above its current level of $20 per share. Jerry can purchase a call option in which he has the option to buy 100 shares of XYZ at a price of $20 per share anytime in the next three months. The option price and premium—say, $2 per share—is much less than the outright purchase price of the stock. If the price of XYZ rises above $20, Jerry can exercise his option and purchase shares at the guaranteed, and now favorable, $20. If, instead, the price of XYZ declines or remains flat during the three- month period, Jerry will allow the option to expire and he will lose his investment. Thus, the option market gives Jerry, an uninformed player, a way to speculate about the movement of the price of a stock by paying a small fee for the option. When investors think that stock prices will rise, they speculate by purchasing call options. When investors are bearish, they speculate by purchasing put options. When investors are very bullish, they buy out-of-the-money call options—those that have a striking price above the current stock price—because they trade at very low prices.
Owners will exercise or sell their call options when they correctly project price increases and their put options when they correctly anticipate price decreases. When investors incorrectly predict market moves, exercising their options is unprofitable. If the owner of an option does not exercise the option by the expiration date, then the option expires worthless.1
It has long been thought that most options expire worthless, indicating that most people purchasing options have incorrectly predicted the direction of market moves. However, recent research indicates that more are exercised than had been thought. In the November 2004 issue of Technical Analysis of Stocks and Commodities, Tom Gentile reports on a study of 30 years of option data conducted by Alex Johnson of the International Securities Exchange who found that only 30% of options expire worthless. Roughly 10% are exercised, and the remaining 60% are closed through offsetting transactions. The percentage expiring worthless, nevertheless, is large and still suggests that many option buyers are uninformed.
Because the purchase of a call represents one who believes the stock market will rise and a put reflects a bearish opinion, a ratio of calls to puts or puts to calls represents the relative demand for options by speculators and, thus, is a hint as to their disposition toward the market. The more call buyers relative to put buyers, the more optimistic are the speculators.
3. Using Put/Call Ratios to Gauge Sentiment
There are several ways to calculate a ratio between puts and calls. Some have used a ratio of the average premium paid for calls versus the average premium paid for puts. In theory, the premium represents the anxiousness of the option buyer and the reticence of the option seller. Statistically, however, this has not been reliable for indicating sentiment. Some analysts have added the price of all options traded each day multiplied by the volume of each trade to arrive at a dollar volume ratio between calls and puts. Not only does this calculation require accurate data and significant computing power, but the information provided by this calculation has not seemed to be particularly useful. Others have calculated a ratio based on the open interest in calls and puts. Unfortunately, this has also turned out to be a mediocre indicator of contrary opinion.
Box 7.5 How We Test and Optimize Oscillators
When an indicator oscillates about a horizontal line within specific bounds, the most common method of discovering buy and sell signals is to use two additional horizontal lines, one for buys (or long positions) and one for sells (or short positions). (In addition to using the sell signals for exiting a long position, they can be used to tell us the optimal profit on the downside if an investor uses them to enter into a short position.) As the indicator declines below the upper line, it gives a signal, and as it rises above the lower line, it gives another signal. If the oscillator is in sync with the market, namely that highs occur at market highs and lows at market lows, the lower band becomes a buy signal and the upper line a sell (or short) signal. In some cases, the relationship between the market and the indicator is inverse, that is when the indicator is high at market bottoms and vice-versa, in which case the upper line becomes the buy line and the lower the sell line. We added one more rule to the testing method that helps keep the number of signals down and avoids many premature signals. This rule states that when a buy signal occurs, the direction and price high of that bar is recorded, and only when a subsequent price trades above that high will the entry buy be executed. For sell signals, the opposite is true: The price must break below the recorded low for an execution to occur.
The level of these lines is determined through optimization of all possible combinations to see a) whether some combination produces a meaningful profit versus the buy-and-hold profit (the profit/loss from holding a long position during the test period), b) what the optimized line values may be for the highest profit, and c) how the optimization results compare to those of other methods and other indicators. While the optimization may show outstanding results, it is likely just curve-fitting to the data and would be unreliable in real time. It is a serious mistake to assume optimized results in a trading model will profit to the same extent in the future. Before using any of the parameters in these tests, you should test them yourself. However, when the combination of method and indicator exceed the buy-and-hold profit, there is a suspected validity to the indicator if not the specific line values.
When the indicator is not bound horizontally and drifts one direction or another, we use a combination of two standard deviations about a moving average of the indicator (similar to a Bollinger Band [see Chapter 14, “Moving Averages”!) to create buy and sell lines that move with the indicator and give signals in the same manner as the horizontal lines. The test is based on a moving average about which is calculated an upper and lower moving band based each as a multiple of the standard deviation about that band average. The variables are the length of the moving average and the standard deviation multipliers that define the upper and lower bands. We then optimize the historical data using the same execution rules as earlier to find the parameters for these variables. Figure 7.2 is an example where the bands are more useful for profitable signals than the simple horizontal lines.

The final, simplest, and most consistent method of calculating puts to calls is to calculate a ratio of the total volume of puts traded in a day versus the total volume of calls (McMillan, 1996). For the stock market, the raw volume statistics as well as the ratio are available in Microsoft Excel format on the Web site of the Chicago Board Options Exchange (www.cboe.com), known as the CBOE, the largest options exchange in the world according to the Futures Industry Association.
Using the moving-band test method (see Box 7.5) on the volume of all stock options, we found that by buying and short selling on the optimized bands, the model returned 196.8% versus 86.4% for buy-and-hold (the gain if no trades were executed during the entire 11 years and 4 months of the study). The parameters for this model were a moving average of 49 days, and an upper and lower band standard deviation multiplier of 0.50 and -1.66 respectively. As Figure 7.2 shows, the data was inverse to the market; thus, the upper band was the buy band, and the lower the sell short band.
Ken Tower, CMT, CEO, and chief investment strategist at Quantitative Analysis Services, Inc., uses a ratio of the 10-day moving average of the put/call volume to the 126-day moving average, roughly equivalent to a 2-week versus a 26-week moving average. Deviations between these two averages determine the extremes in option emotion. A high ratio suggests more put buyers than call buyers, indicating that the uninformed players are pessimistic.
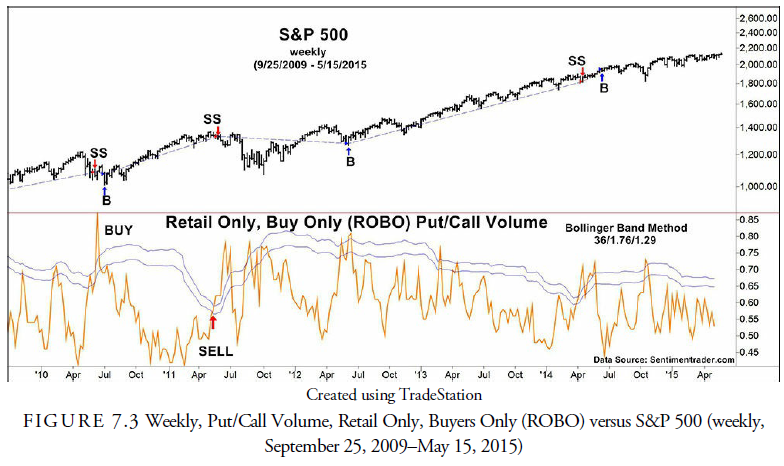
One method of differentiating those who are buying options for speculation from those professionals who are hedging, used by Jason Goepfert (www.sentimentrader.com), in his studies of options as a proxy for sentiment, is called ROBO for put/call volume Retail Only, Buy to Open. Uninformed market players tend to use the daily opening to enter their speculative option orders. The option data used in the indicator is the number of options bought by investors on the opening of trading. They usually deal with small amounts. To further constrain the data, Goepfert limits the opening trade size to 10 options to eliminate the potential distortion from any large, institutional buyers.
Figure 7.3 is a chart of ROBO versus the S&P 500. When we optimize the weekly ROBO data and compare it to the S&P 500 since May 26, 1995, we find that the system model optimizes with a 164.1% return versus a 75.1% return for the buy-and-hold. The specific inverted levels for the buy and sell lines, marked on Figure 7.3, were a length of 36 weeks, an upper band of 1.76 standard deviations, and a lower band of 1.29 standard deviations.
4. Volatility and Sentiment
Another strategy for analyzing the behavior of the uninformed market participants is looking at volatility. Volatility is a measure of the amount by which a security price oscillates, usually about its mean, without regard to its trend over a specified period. The most common calculation for volatility is the standard deviation about the mean. Historical (or realized) volatility is the standard deviation of prices in the underlying security about its mean over some past period. The 100-day volatility, for example, is the amount by which a security oscillated over the past 100 days about its mean. In Figure 7.4 by Ned Davis Research, Inc., volatility is calculated with a ratio of the 12-month difference between the yearly high and low to the 12- month moving average of the high-low difference. While having some predictability in that form, it is shown to demonstrate how volatility is mean reverting, oscillating about its long-term mean but always returning to it.

As in security returns, however, this is not an absolute. Just as there are fat tails in the distribution of price returns, fat tails also occur in volatility distributions. Another common assumption is that volatility is independent of price return. In other words, adherents to this assumption claim that the ability to predict the volatility of a security will not aid in predicting the future price direction or return. Some evidence refutes this hypothesis. Volatility is often a measure of the anxiousness of the players in the security market, increasing as they become nervous and decreasing as they become complacent. Because the players act as a crowd and are often uninformed, volatility can be a predictive factor in markets. In the chart, the high volatility occurs when the ratio rise above 26%. That usually occurs at a market low; thus, the subsequent action is upward.
Conversely, although not as accurately, a low volatility suggests a flat market ahead because low volatility occurs when investors are less anxious. Let us look at some other ways to measure volatility.
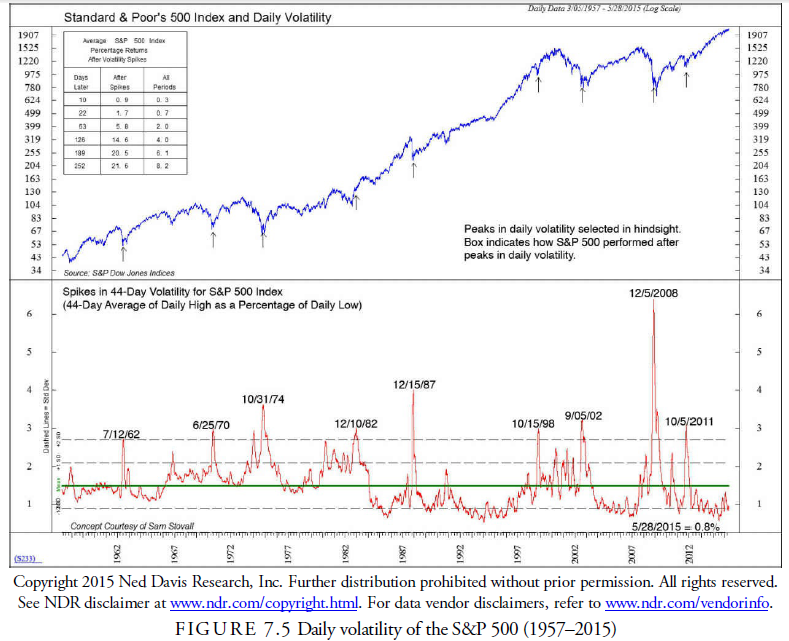
Ned Davis Research, Inc., often uses a horizontal line method of signaling buys and sells. Figure 7.5 is an example of this type of chart on the daily S&P 500 volatility, calculated as the 44-day moving average of daily high as a percentage of daily low. The signals come as multiples of the standard deviation about the horizontal mean for the whole period 1957-2015. Extraordinary spikes of 2.5 standard deviations or more occur almost always at market bottoms and provide a reliable buy signal when they occur (9 times in 58 years or once every 6.4 years).
5. Using Volatility to Measure Sentiment
Implied volatility is a figure derived from the Black-Scholes option formula. The Black-Scholes option-pricing model, the most common method of determining the value of an option, suggests that the price of an option is a function of the spread between the underlying security price and the strike price of the option, the time remaining in the option, the prevailing interest rate, and the volatility of the underlying security. If we know the price, the strike price, the price of the underlying security, the interest rate, and the time remaining in an option, we can calculate the only missing variable—the implied volatility. Thus, implied volatility is the volatility implied by the option traders in their pricing of the options in the marketplace. Implied as well as historic volatility correlates to some extent with market prices. High implied volatility tends to occur at periods of stress, emotion, uncertainty, fear, and nervousness, most often peaking at a panic bottom. On the other hand, low implied volatility seems to occur during market rises and market peaks when emotions are calm, content, and relaxed. By looking for extremes in implied volatility then, because it expresses the expectations of those option traders, we can determine market emotion.
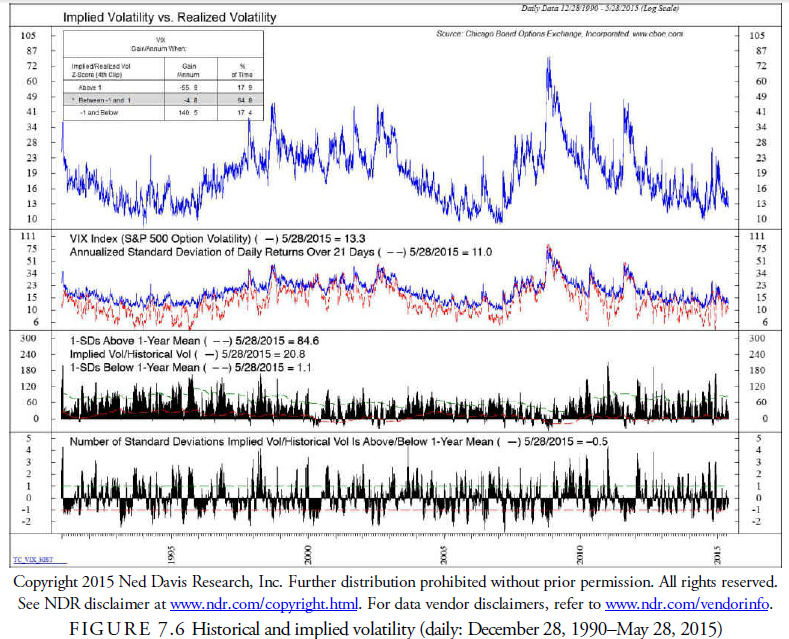
VIX is the exchange symbol for a percentage indicator of implied volatility in Standard & Poor’s 500 options. Volatility in the Nasdaq Composite and the S&P 100 Index are represented by VXN and VXO, respectively. VIX, VXN, and VXO are traded on the CBOE as futures and options. Instead of measuring historical volatility, these indicators measure implied volatility. Historic volatility is past volatility and generally oscillates with past anxiousness. By looking at implied volatility, the analyst hopes to measure market participants’ anxiousness about the future. As Figure 7.6 shows, the two volatilities do not overlay precisely. This is because they represent two thoughts, the past and the present. Ned Davis Research, Inc. calculates a ratio of implied volatility to realized volatility and found that in the past when the ratio exceeded 1 the S&P 500 declined on average 55.9% per annum, while when the ratio was below -1, the S&P 500 advanced 140.5%. Most of the time (65%), the ratio remained between the two extremes. This is quite characteristic of the usefulness of sentiment as a market signaling method. Extremes in sentiment are the most meaningful and tend to be accurate contrary indicators, but most of the time, sentiment remains in the middle and is not useful.
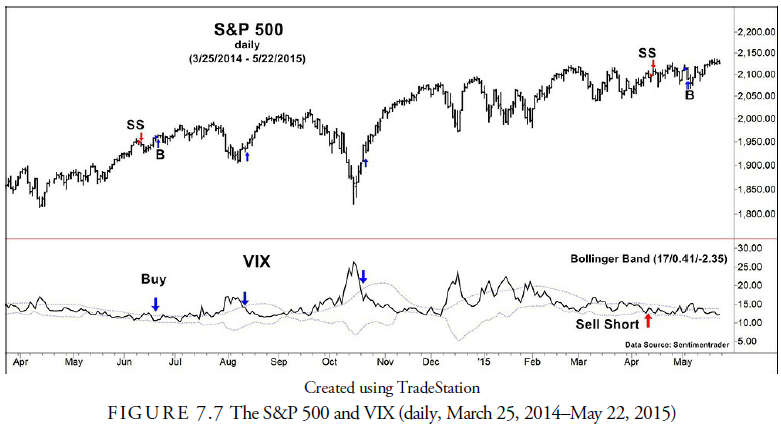
The most common use of VIX in market timing is to plot the raw figures and observe where the upward spikes occur because these usually mark an important market low (see Figure 7.7). We ran the VIX numbers through the moving band optimizing method and found that the best model from the optimizing produced a 512.7% return over 20 years versus a 259.9% buy-and-hold return. The parameters for this model were a 22- day period and a 1.08 and -0.68 multiple for the upper and lower standard deviation multipliers, respectively.
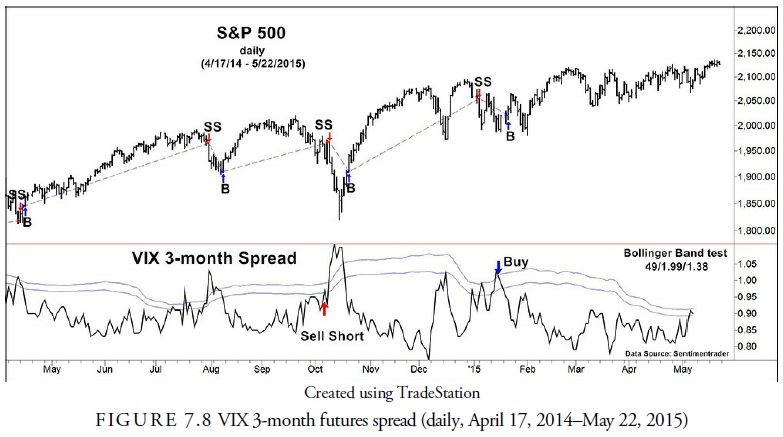
Another method suggested by Goepfert to use the VIX as a market-timing indicator is the VIX 3-month spread. This is the difference between the price of VIX futures 1-month out and 3-months out and is shown in Figure 7.8. According to Goepfert, “the spread will be high if futures traders think volatility is going to spike in the near-term,” and will be low if VIX traders are complacent. Because high volatility is associated with market bottoms, a high in the spread should signal when to buy. We tested this concept with the moving band method and found that, indeed, the spread had a predictive capacity. The model produced an optimal 197.5% return versus the 74.0% buy-and-hold over 10 years. The band moving average period was 49 days, and 1.99 and 1.38 were respectively the upper and lower multipliers of standard deviation.
6. Polls
One way to measure the sentiment of market participants is simply to ask the players if they are bearish or bullish. Although this might appear to be the most straightforward way of gathering information about expectations, sampling problems and other biases associated with poll taking exist. Despite these biases, poll results, if measured over a constant time interval, can give some idea of the public mood. Poll results are contrary indicators because they express optimism at market tops and pessimism at market bottoms. Polls, thus, gather information and measure the sentiment of uninformed investors. Several different companies collect and publish sentiment information based on polls. Let us look at a few of these.
7. Advisory Opinion
Investors Intelligence (www.investorsintelligence.com), a wholly owned U.S. subsidiary of Stockcube Plc, a UK company located in New Rochelle, New York, provides sentiment information in its Advisory Service Sentiment survey. Since 1963, the company has read approximately 120 independent (“not affiliated with brokers or mutual funds”) investment-advisory newsletters every week and determined the percentage of those that are bullish, bearish, or expecting a correction. Intuitively, it seems that newsletter writers would be more sophisticated and, thus, more in tune with the market than the public they advise, but the numbers over the past 40 years instead show a tendency to be incorrect, especially at market extremes. Thus, this survey provides information about the uninformed players and works as a contrarian indicator. What they have found is that when the percentage of bearish advisors is greater than 50 and the percentage of bullish advisors is less than 25, a buy signal occurs in the general stock market. On the other hand, when the percentage of bearish advisors declines below 20 and the percentage of bullish advisors exceeds 55-60, a sell signal occurs. They neglect showing any tests of these levels and have derived them purely from observation of the statistics over 45+ years.
The profitability of using this information to make trading decisions is questionable. Solt and Statman (1988) found no statistically significant relation between the sentiment of investment newsletters and stock returns: The raw numbers and several ways of looking at them have not proven to be informative in the past. Colby (2003) found no profitable results in the crossing of advisory data exponential moving averages between 1 and 1,000 weeks.
However, several studies by others have shown that with certain modifications, the advisory sentiment in the past has been a somewhat reliable indicator of future stock market price action. We optimized the ratio with the moving band test method and found a reasonably profitable result shown in Figure 7.9.

A standard calculation of advisory sentiment is the ratio of the percentage of bullish advisors to the total of the percentages of bullish and bearish advisors. This is then plotted, and the signal levels are determined. With these figures, we optimized using the moving band test method and found that the best model produced a 310.5% return versus the 184.0% buy-and-hold using parameters of 36 weeks for the 20-year period, and 1.91 and 1.26 respectively for the upper and lower standard deviation multiple.
Ned Davis Research Inc., as shown in Figure 7.10, used a ten-week simple moving average of this ratio and determined that a rise above 69% in the ratio resulted in a gain per year of 1.4%, and a decline below 53% produced a gain per year of 12.0% over the period September 18, 1970 through May 22, 2015. For long trades only, the annual percent gain using horizontal line crossovers was 10.1% versus 7.4% for buy-and-hold. These are credible results.

Copyright 2015 Ned Davis Research, Inc. Further distribution prohibited without prior permission. All rights reserved.
See NDR disclaimer at www.ndr.com/copyright.html. For data vendor disclaimers, refer to www.ndr.com/vendorinfo.
F IG U R E 7.10 Investors Intelligence Advisory Opinion, ten-week moving average bulls/(bulls + bears)
(weekly, September 1970–May 22, 2015)
Colby (2003) also suggests that when a large percentage of advisors are bearish, market prices will rise. He suggests using advisory sentiment to find these periods of extreme pessimism by using an optimistically skewed decision rule. In this decision rule, investors take a short position whenever the percentage of bearish newsletters is greater than the 54-week exponential moving average of bears plus ten percentage points. Following this strategy over the 1982-2001 period would have resulted in a net profit of 70.3% over the profits of a buy-and-hold strategy.
8. American Association of Individual Investors
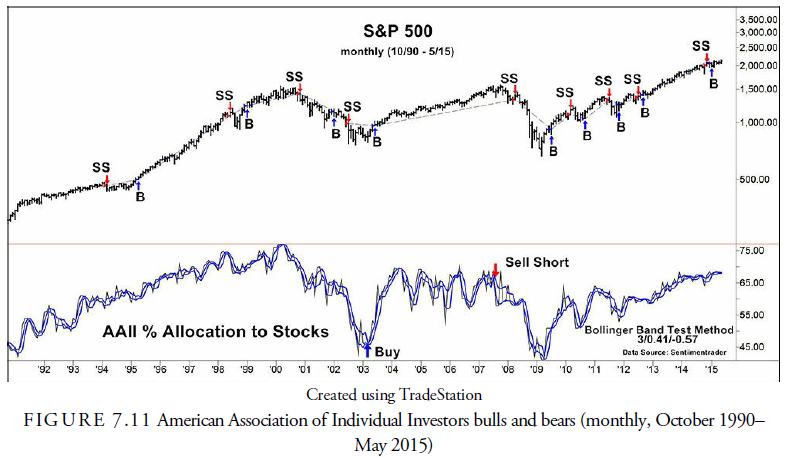
The American Association of Individual Investors (AAII; www.aaii.com) compiles a daily poll from its 150,000 members on what they believe the stock market will do over the next six months. De Bondt (1922) found that the members polled by the AAII tended to forecast as though they expected a continuation of the past stock returns. We tested the raw number of percentage allocation to stocks with the moving band method (see Figure 7.11) and found a return of 590.8% over 21 years versus a 353.8% return for the buy-and-hold. The parameters were 3 months and -0.41 and -0.57 for the standard deviation multipliers. The negative multipliers indicate that the signals came for low levels in the band, suggesting that bearishness is more reliable as an indicator than optimism.
9. Consensus Bullish Sentiment Index
Consensus, Inc., (www.consensus-inc.com) of Independence, Missouri, draws from a mix of brokerage house analysts and independent advisory services to compile the Consensus Bullish Sentiment Index. The data covers a broad spectrum of approaches to the market, including the fundamental, technical, and cyclical. Consensus, Inc., considers only opinions that have been publicized.
10. Market Vane
Market Vane Corporation (www.marketvane.net) of Pasadena, California, polls 100 leading commodity trading advisors every day for their opinions of the futures markets, principally: stock indexes, T-bonds, gold, silver, Yen, crude oil, soybeans, live cattle, sugar, and others. This data is then used to construct the bullish consensus statistics published in Barron’s every week.
11. The Sentix Sentiment Index
Originated in February 2001, the relatively new Sentix Index (www.sentix.de) is a comprehensive poll of German investors about their opinion of the markets, including the U.S. stock and bond markets. The poll is taken every week on Friday, and the results are published each Monday morning in Germany. About 3,100 people (among them more than 690 institutional investors) are asked about their opinion on 12 different markets: DAX-Index, TecDAX (German technology stocks), EuroSTOXX 50, S&P 500, Nasdaq Composite, Nikkei-Index, Bund-Future, T-Bond-Future, EUR-USD currency, USD-JPY currency, gold, and oil. The poll includes the investors’ expectations for one month (short-term) and six months (medium-term). Hubner (2008) has described several uses of the Sentix data for anticipating market direction, and van Daele (2005) used the Sentix data for his PhD thesis on why “noise traders” act the way they do.
12. Consumer Confidence Index
The Conference Board (www.conference-board.org), producers of the index of leading economic indicators and the help-wanted index, reports on consumer confidence each month. The Consumer Confidence Index is based on a representative sample of 5,000 U.S. households. The survey is based on consumer expectations for the U.S. economy. Like most other opinion polls, the survey has been a contrary indicator to the stock market. As seen in Figure 7.12, Ned Davis Research, Inc., found that between 1969 and 2015, when the survey number rose above 113, demonstrating that consumers were overly optimistic, the stock market remained relatively flat (0.2% per year). However, when consumers were predominately pessimistic and the survey number declined to below 66, the stock market rose on average 14.8% per annum.

13. Other Measures of Contrary Opinion
The poll-based measures of market sentiment that we have just discussed are based upon what market participants say their market opinions are. Of course, we are not so much interested in whether market participants say they are optimistic; what we are really interested in is how much their level of optimism is resulting in buying and security price increases. Now we consider some other measures of contrary opinion that are based upon movement of money within the markets.
14. Buying and Selling Climaxes
Investors Intelligence (www.investorsintelligence.com) uses the term climax to describe a specific event that occurs over a 1-week period. A buying climax occurs when a stock makes a new 52-week high but then closes below the previous week’s close. A selling climax occurs when a stock makes a new 52-week low and then closes above the previous week’s close. “The reason for such a rigid definition for climaxes is that this enables us to classify accurately and consistently what is and what isn’t a climax. This is important as we maintain historic records of the climaxes generated each week and have noted that important market turning points are often accompanied by a sudden rise in the number of buying or selling climaxes,” states Investors Intelligence. Figure 7.13 shows the buying and selling climaxes from May 2014 through May 2015. Their work shows that sellers into buying climaxes and buyers into selling climaxes are correct in direction about 80% of the time after four months.

15. Mutual Fund Statistics
Because mutual fund investors are mostly from the uninformed public sector, mutual fund statistics can often be useful in determining what the uninformed is thinking and doing. The most reliable statistic is the cash reserves in stock mutual funds as a percentage of the assets and adjusted for interest rates.
16. Mutual Fund Cash as a Percentage of Assets
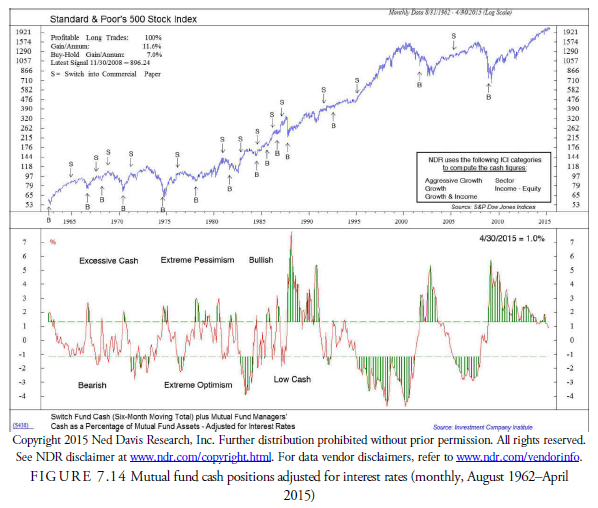
It has long been known that mutual fund cash holdings are contrary indicators for the stock market. There are many reasons for mutual funds to hold cash, but the bottom line is that high levels of cash usually occur at stock market bottoms. Jason Goepfert (2004), in his Charles H. Dow Award paper, building on earlier work by Fosback (1976) and Ned Davis Research, Inc., found that adjusting mutual fund cash for the interest rate is an even more reliable indicator than the cash percent position by itself. When mutual fund cash, adjusted for interest rates, during the period from January 1962 through April 2015, declined to below its lowest threshold, the stock market rose on average 8.1% over the following year. When the cash level was at its highest, the stock market declined by an average 6.1% over the following year.
Ned Davis Research, Inc., found essentially the same relationship with mutual fund cash percentage, adjusted for interest rates, and the stock market (see Figure 7.14). By measuring the deviation from the 13- month average of the stock mutual fund cash/assets ratio, adjusted for interest rates and during the period from August 1962 through April, 2015, a buy long only signal at a level above 0.1 and a sell below -1 produced a
17. Rydex Funds
Mutual fund management companies within the past few years have presented both style and leverage to their public offerings. Rydex Global Advisors (www.rydexfunds.com) has been particularly inventive in its styles. Not only do these include standard long-only stock mutual funds, but also funds that replicate market averages, such as the S&P 500 and the Russell 2000, and others that add leverage to the portfolios. These are called bull funds because they increase in value when the stock market rises. Contrarily, Rydex offers inverse funds in the same style that are short the averages and other indexes. These are called bear funds because they increase when the stock market declines. If the public expects the market to rise, they will purchase the bull funds and sell the bear funds, and vice versa. The ratio of the assets held by these two funds, thus, indicates what direction the uninformed investors in the funds expect the market will travel.
Ned Davis Research, Inc., found that when these investors become optimistic, invariably the market performs oppositely. Indeed, from January 1994 through April 2015, when the ratio rose above 82.5 and more people were purchasing the bull funds than the bear funds, the stock market declined 5.8% per annum. And when these investors loaded up on the bear funds and the ratio declined to 52.2 or below, the stock market advanced 52.2% (see Figure 7.15). These results show an outstanding relationship between sentiment and future market direction.

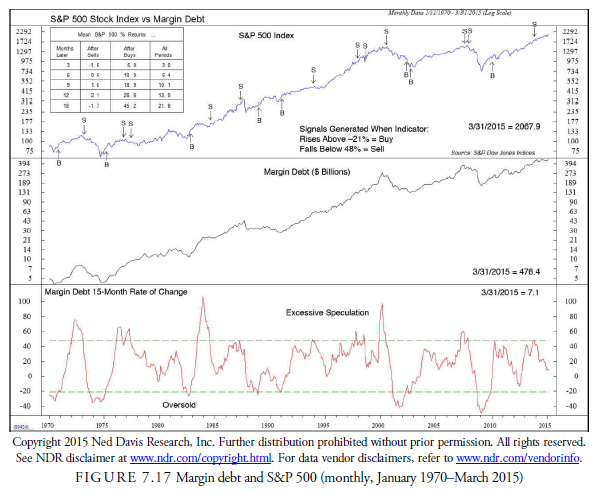
18. Margin Debt
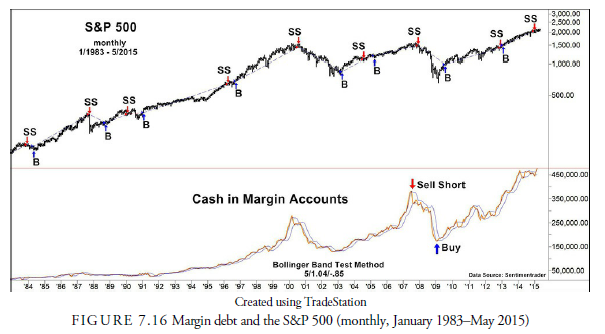
Each week, Barron’s reports the NYSE margin debt figures for the previous month. Traditionally, analysts have considered margin balances evidence of what the uninformed speculator is doing, especially at market peaks. Remember that when uninformed investors are most optimistic, they have placed most of their capital in the market and, thus, may buy stocks on margin to leverage their position. More recently, a concern of margin account followers has been that margin debt reflects professional speculators and might not be as useful as before. Additionally, possibly taking away from the usefulness of margin debt for market forecasting is the ability through derivatives of holding positions outside the Federal Reserve requirements for margin, which only apply to banks. Part of the risk incurred by the Long Term Capital Management (LTCM) operation was over a trillion dollars in derivative contracts, most of which required little margin account debt. Despite these concerns, our optimization of margin debt with the moving band test method showed that over the past 44 years, the return has been 3,810% versus 2,045% for the buy-and-hold return (see Figure 7.16). More interesting is the observation that every major decline since 1983 had been signaled, even the 1987 decline, as well as every major market bottom. Some signals were false but were corrected within a few months with minimal losses. The parameters for the optimized model are a 5-month period and 1.04 and -0.85 for the respective upper and lower band, standard-deviation multipliers respectively.
New Davis Research, Inc. used the horizontal line method rather than the moving band method to test margin debt as an indicator of market direction. Using the 15-month rate of change as the indicator, a buy line of -21%, and a sell line of 48%, it found that 18 months after a buy signal the market on average had gained 45.2% during the period January 1970 through March 2015 (see Figure 7.17). Sell signals were not as important because their post-signal performance was flat. One reason for the lackluster sell signal, as in many other sentiment indicators, was that the signal comes early in the investment cycle. Optimism develops slowly and often continues for longer than expected, whereas panic is usually quick and steep, providing a price bottom quickly and more clearly.
19. Money Market Fund Assets
Whereas margin debt looks at speculators who are borrowing money to leverage their positions, money market funds are the repository of funds when uninformed players decide to pull back from the markets and hold cash equivalents. As a contrary opinion indicator, we would expect that money market fund assets would increase as investors become more pessimistic and that would, thus, be a sign that the market is bottoming. Ned Davis Research, Inc., found exactly that relationship in the size of money market assets (see Figure 7.18). By normalizing a 13-week rate of change and determining the horizontal lines for buying and selling, they found that while moving upward relative to the prior week, a rise above 28.6% resulted in a 27.1% subsequent annual gain, whereas moving downward through 17.9% gained only 7.8%. In other words, when the rise decelerates for a week, the upward prospects for the stock market diminish. This is an interesting result because it implies a momentum behind investment in money market funds: once it has stalled, it affects the future performance of the stock market.

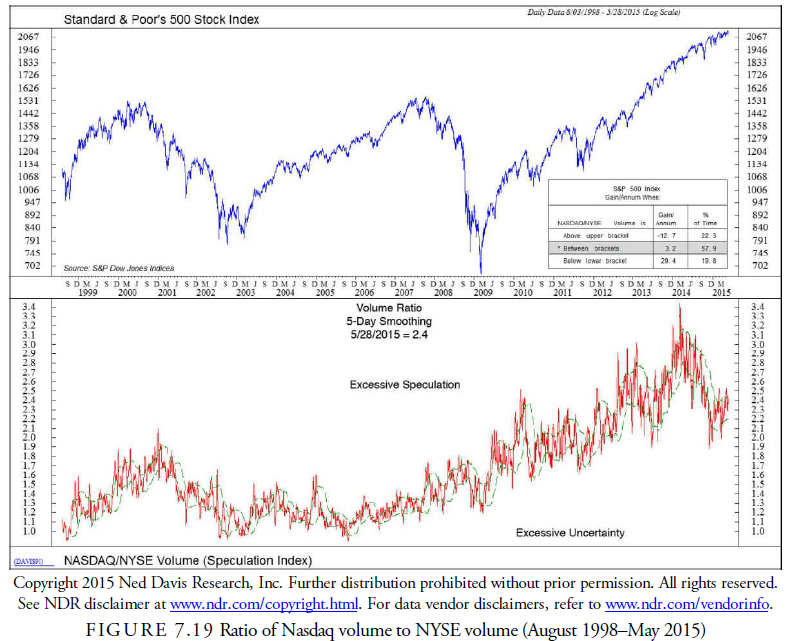
20. Relative Volume
Another reliable indicator of uninformed sentiment is the ratio of Nasdaq to NYSE volume (see Figure 7.19). This ratio gradually increases as public enthusiasm for speculative stocks on the Nasdaq increases, and Nasdaq volume increases relative to NYSE volume. The peak in a trend seems to occur when the ratio peaks, and the bottom of the trend occurs after the bottom in the ratio. Ned Davis Research, Inc., during the period August 1998 through May 2015, found that when the volume ratio increased above an undefined bracket, the S&P 500 lost 12.7% per annum, and when the ratio declined below a lower undefined bracket, the S&P 500 gained 29.4% per annum, making this an indicator with a profitable history.
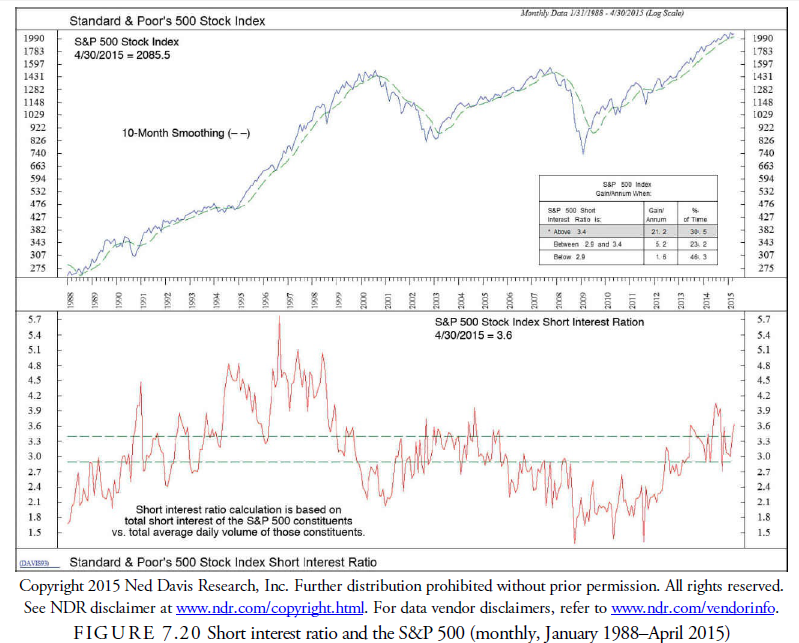
21. Uninformed Short Selling
Historically, short selling has been predominately a professional activity. It is even more so today with the many derivative securities traded. The modern use of derivatives requires short selling to reduce risk. Thus, the old relationship of short selling having to do solely with opinion about the prospect for companies has diminished. On the other hand, the total amount of short selling seems to increase with an increase in the market direction and is, thus, still a contrary opinion indicator.
The Short Interest Ratio is calculated from data provided by the major exchanges, traditionally the New York Stock Exchange, on a monthly basis, and reported in Barron’s and other financial papers. It is calculated by taking the total amount of stocks sold short as of the specific day of the report divided by the average volume for the month. Colby (2003) reports that, over the 69 years of data from 1932 to 2000, using a buy signal when the current ratio was greater than its 74-month exponential moving average and a sell signal when the 74-month average was broken, a sizable return resulted; however, it still underperformed the buy-and-hold strategy. This signal worked only for long positions and was out of the market for 457 months, more than half the time.
Ned Davis Research, Inc. (see Figure 7.20) found the raw ratio to be a useful indicator for long signals when it rose above 3.4%. The subsequent annual gain was 21.2% during the test period of January 1988 through April 2015. Interestingly, these results occurred during the recent periods of derivative use when short selling was an active part of the hedging process.
As for the usefulness of short selling data on individual stocks and determining the potential for a “short squeeze,” which is the rapid rise in a stock’s price as short sellers scramble to cover, data on individual stocks is available but is often clouded by many variables. To get at information that is more useful on a company basis, considerable digging and filtering must be done to eliminate the influence of derivative transactions that may have little to do with the prospects for the firms. Phil Erlanger (erlanger.com) accomplishes a considerable amount of work in this area and publishes results periodically on his Web site. He has found several filters that must be applied to individual stock short sale data: (1) The data must be adjusted for splits—not only price adjustments, but also volume and short interest; (2) it must be normalized to adjust for short-term volume fluctuations; and (3) it must be normalized to adjust for historic volatility. A ranking is established, placing the stock within its smoothed, historical context over a five-year period. This ratio establishes the potential attractiveness of the stock. This number should not be used as a mechanical buy signal, however, because the short sellers may be correct in anticipating the stock to decline.
22. Unquantifiable Contrary Indicators
Over the years, analysts have watched a number of developments in the society around them in an attempt to gauge the overall mood, emotion, and sentiment of market participants. Many of these indicators are qualitative and not quantitative. Although these indicators are not easily quantifiable and do not lend themselves to traditional statistical testing, they still provide important information to the technical analyst.
One of these unquantifiable indicators is the magazine covers theory. The media covers the news but with a strong bias. It is selling news to those who are interested. If the stock market is high and ready to decline, the media would be unlikely to report the danger even if they know it. Instead, they would emphasize the fact that the market has risen and is strong. They want people to listen, to subscribe, and to read their output, and they will not get business if they report contrary to the popular beliefs of the day. Their business is providing their subscribers with what they want. Thus, when major news magazines such as Time, Newsweek, U. S. News and World Report, Barron’s, The Economist, or BusinessWeek include on their cover an article on the stock market, up or down, they are emphasizing what the public believes and already knows—and as has been shown previously, the public is generally wrong, at least at extremes. For this reason, these stories usually occur at or before major turning points in the stock market.
Paul Macrae Montgomery, currently with Universal Economics, has studied magazine covers back at least to 1923. He has observed that after a positive major magazine cover story on the stock market, 60% to 65% of the time the market has gained about 30% per annum over the first one to eight weeks. Eighty percent of the time, however, the market has then reversed within a year and sustained significant losses (Baum, 2000).
In 2007, University of Richmond Professors Arnold, Earl, and North (2007) published in the Journal of Finance a study on the market action of the stock of companies featured as cover stories in BusinessWeek, Fortune, and Forbes between 1983 and 2002. They found that the cover feature article usually followed the stock performance rather than the reverse. A negative story, for example, tended to occur after the decline in the company’s stock, and a positive story occurred after a stock rise. They did not find any statistically significant results in postarticle performance, either momentum or contrary (with or against the previous trend). They concluded that if one has a position in a stock that had a good run up or down and a cover story appeared in one of those magazines explaining the reason for the price move, it was probably time to close the position.
Not only does the media report about the market (which provides some idea about the sentiment of the market players), but the reports of the media also impact the mood and emotions of investors. A study commissioned by the Wall Street Journal (Klein and Prestbo, 1974, as reported in Kaufman, 1998), found that 99% of financial analysts read a newspaper regularly. Ninety-two percent of these analysts considered the newspaper the “most valuable” publication they read. Obviously, the news is important. However, rapid and correct interpretation of facts is difficult. Sometimes factual news is immediately interpreted by the market incorrectly. For example, when Saddam Hussein was captured, the stock market opened up with a large gap just from the joy of the news. When investors thought about the consequences of that news, they realized it did not change anything, and the stock market closed down that day. Informed traders in a method called “event trading” likely sold into this emotional opening. It is a method of rapidly gauging the sentiment produced by a news announcement, determining whether the market is overacting, and if it is, acting contrarily. Another aspect of event trading is gauging whether the market or a stock is acting as it should on particular news, and if it is not, perhaps the news was already discounted in the price and a change in direction is due. Event trading or news trading is a very short-term use of contrary opinion.
Box 7.6 Eccentric Sentiment Indicators
Over the years, stock market followers have developed a number of “eccentric indicators” to predict stock market movements. Not based on economic or financial data, these indicators are “feel-good” or “hype” indicators that attempt to measure the overall morale of the investing population. One of the oldest feel-good indicators, first suggested by either the late Ralph Rotnem of Harris, Upham & Company (now, after a long string of mergers, Citibank) or Ira Cobleigh & DeAngelis (1983), followed women’s hemlines: as hemlines rose, so did the stock market, and as hemlines fell, so did the stock market (see Figure 7.21). Consider the Roaring 20s, when women wore short flapper skirts and a stock market rise followed. When
the stock market crashed during the great depression, long, modest skirts followed. The hemline index implies that as people become more exuberant, stock prices rise and clothing becomes more daring, and as society becomes more pessimistic, people become more conservative with their clothing and investment choices. Market and economy watchers have also considered beer versus wine sales (people drink more beer when the market is down and approaching a low), sedans versus coupes (people buy more sedans and fewer coupes when the market is down), lipstick sales (when the market is down, women buy cheaper brands), aspirin (a rise in sales correlates with distress about the market), and the number of golf balls left at the driving range (people don’t leave balls when the market is declining).
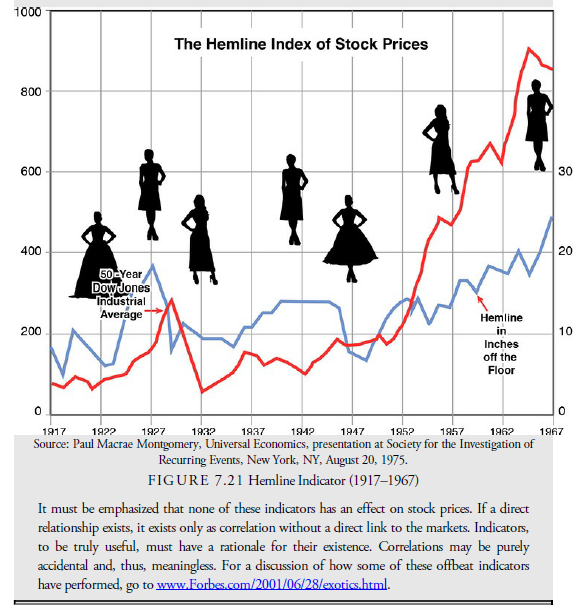
It must be emphasized that none of these indicators has an effect on stock prices. If a direct relationship exists, it exists only as correlation without a direct link to the markets. Indicators, to be truly useful, must have a rationale for their existence. Correlations may be purely accidental and, thus, meaningless. For a discussion of how some of these offbeat indicators have performed, go to www.Forbes.com/2001/06/28/exotics.html.
23. Historical Indicators
Technical analysts have used several indicators that you may see discussed in the literature. Although these indicators have little relevance today, at one time they played a prominent historical role in the measurement of market sentiment.
The first is NYSE member and nonmember statistics. The advent of off-board trading and of electronic trading, complicated by the use of derivatives for hedging, marginalized the usefulness of this data. At one time, the various ratios (nonmember short sale ratio, public to specialist short sale ratio, and specialist short sale ratio) had some useful, predictive meaning in the stock market. No longer, however, do these figures mean anything. Because the marketplace itself has changed so drastically, the member figures have gone out of use and are considered unreliable.
The second historically important sentiment indicator to have fallen from favor is the Barron’s Confidence Index. This index, developed in 1932, measures the ratio of yields on high-grade bonds versus yields on speculative bonds. Although it is still published today, it seems no longer to have relevance for measuring stock market sentiment.
24. Unusual Indicators
We add here several sentiment indicators for the stock market that are unusual and may not come to mind immediately as having any kind of relationship to the market.
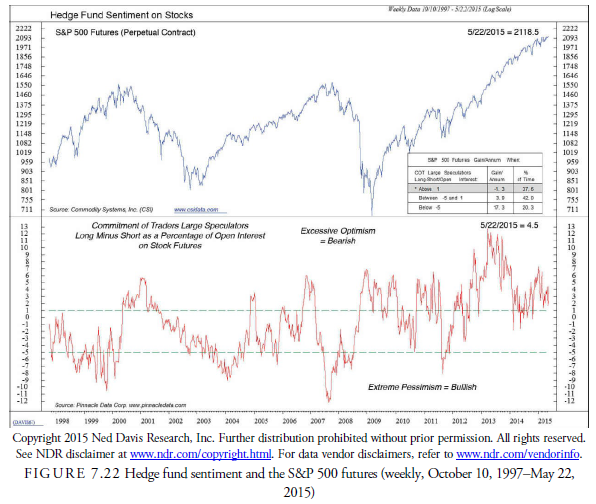
Hedge fund managers (see Figure 7.22) should be considered informed players because their livelihood depends on their skill at investing and trading. They seem to go through bouts of uncertainty especially when the market is high, but generally their pessimistic sentiment works out with a market decline. In 2009, they were timing the market bottom extremely well, being optimistic right at the low. But in 2011, they were incorrectly pessimistic right at the correction bottom. The estimate of hedge fund sentiment comes from the COT data for large speculators and is calculated as longs minus shorts as a percent of open interest in the S&P 500 futures. Rather than the horizontal lines for signals, this is a series that could benefit from the moving band method of testing. Nevertheless, when the percentage long declined below -5%, the annual rate of return jumped to 17.3%.
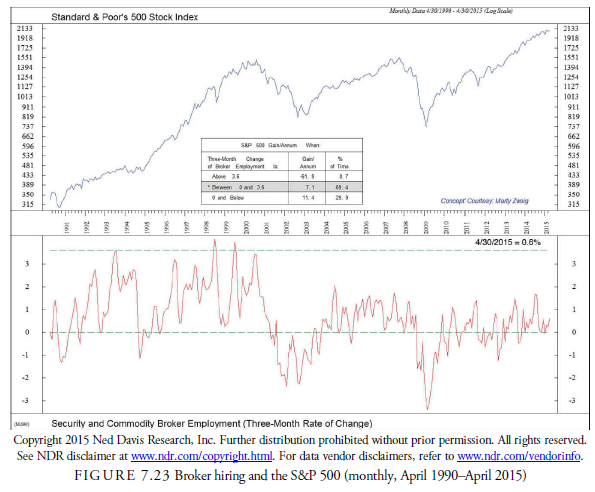
It’s not that the brokerage industry is unable to time the market with their hiring; it’s the interest and trading of their customers that causes hiring of brokers to peak at a market top and bottom at a market trough. This reflects the customer demand and how to profit from going against the crowd. The crowd wants investments at the peak of the market, and brokerage firms hire new brokers to handle the business right at the wrong time. The results of the study in Figure 7.23 show that when the hiring of brokers reaches above 3.6%, the annual rate of growth in the market crashes to -61.9%. It only rises again once the brokerage firms have begun letting brokers go.
Cash is usually the most fluid of household financial holdings and tends to act as a buffer against changes in income and expenses until the time comes when nonliquid financial assets have to make up the difference. In this manner, the amount of cash represents the liquidity and personal profit of a household; when it is rising, the household is gaining and is happy. When times get tough, cash goes out faster than it comes in and the cash reserves dwindle. Thus, cash is a reflection of how the normal household is fairing in the economic world; as such, it also reflects the sentiment of the household. When cash levels are high, households are spending and the stock market is approaching a peak. Although Figure 7.24 shows that cash and the market correlated well in the period from the 1950s through 1990, the close relationship inverted then and cash drained away while the market was still rising and was actually very low when the market peaked in 2000. Additionally, notice that the market reached intermediate-term lows when the households’ cash position had improved and highs when cash was plenty. Have household suddenly become excellent market players?

Figure 7.25 shows the fickleness of the voting public. It can go from unhappiness and depression to euphoria rather quickly, but notice that the shape of the curve is more gradual when opinion is becoming favorable, and when it turns down, opinion crashes. This is similar to the stock market that takes time for greed to build upon itself but will crash when the tide turns to panic. The phenomena is universal and not just limited to markets and politics. It is obviously a characteristic of mankind that goes beyond reason. However, to profit from this human foible, the investor must counter the crowd and be rational—aware of when the sentiment has become so excessive that a reversal is due soon. That ability to step back and rationally look at one’s surroundings and mood improves the odds of being successful in the markets.

Source: Kirkpatrick II Charles D., Dahlquist Julie R. (2015), Technical Analysis: The Complete Resource for Financial Market Technicians, FT Press; 3rd edition.
7 Jul 2021
7 Jul 2021
7 Jul 2021
7 Jul 2021
7 Jul 2021
7 Jul 2021