Confirmatory factor analysis (CFA) is a statistical technique that analyzes how well your indi- cators measure your unobserved constructs and if your unobserved constructs are uniquely different from one another. In a CFA, an unobservable construct is often referred to as a “fac- tor”. So, when I use the term “factor”, it represents an unobservable construct we are trying to measure. In a diagram format, an unobserved variable is represented by a circle or oval.The indicators that measure the unobserved variable will have single headed arrows coming from the unobserved construct to each of the indicators. Each indicator is represented by a square or a rectangle. The single arrow line directly from the factor, or unobservable construct, to the indicator represents the influence that is reflected from the unobservable construct to its indicators. Statistical estimates of these direct effects are called “factor loadings” and are inter- preted as regression coefficients that may be in unstandardized or standardized form. Indica- tors that “reflect” an unobservable construct or factor are called simply reflective indicators. In special instances, some indicators are classified as “formative”, and they will be discussed later in the chapter (page 110).
With most indicators, a level of error is present. Each measurement error of an indica- tor represents “unique variance”, or variance not explained by the factor level. Measurement errors are represented by two types of unique variance: random error and systematic error. Random error occurs when the measurement of a concept is unpredictably fluctuating due to unforeseen or random influences. This type of error is considered “noise” because there is often no consistency to the measurement error. Systematic error is different in that the error is systematic in nature. The results of a measurement can be consistently high or low due to a systematic influence in the measurement of a concept. For instance, taking a survey online as compared to a paper and pencil survey may systematically influence the way respondents answer questions about a construct. With systematic error, this is often classified as a “bias” compared to the “noise” of random error. Note that if an unobserved variable has only one indicator, then the error term for the single indicator variable is constrained to have a mean of 0 and a variance of 0. (You must assume the indicator has no measurement error—which is often a very flawed assumption.)
In a CFA, you also want to account for “unmeasured covariance”. To do this, a two-headed arrow is drawn between all independent unobservable variables. In a CFA, the analysis will treat all unobserved variables as exogenous or independent variables. Thus, you will draw a covariance double headed arrow between each unobservable construct in a CFA. If you don’t do this, AMOS will give you an error message stating that a covariance should be drawn between all unobserved constructs in your CFA.
As an example, let’s use our Customer Delight construct mentioned earlier, and now let’s include another construct of how likely a consumer is to spread positive word of mouth about an experience.The diagram of this simple CFA would look like this:
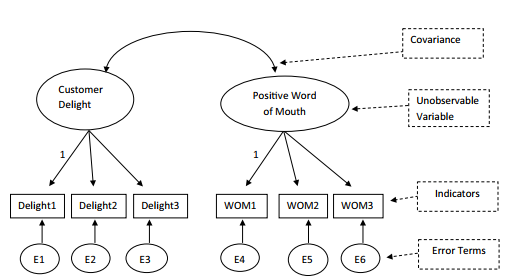
Figure 4.1 Two Construct CFA Analysis
A word of caution: do not use “E” and a number for an unobserved or observed variable name.The letter “E” is reserved for an error term.
Source: Thakkar, J.J. (2020). “Procedural Steps in Structural Equation Modelling”. In: Structural Equation Modelling. Studies in Systems, Decision and Control, vol 285. Springer, Singapore.
22 Sep 2022
29 Mar 2023
28 Mar 2023
27 Mar 2023
31 Mar 2023
29 Mar 2023