Itemized rating scales are used to help the researcher obtain a measure of attitudes. The researcher first develops a number of dimensions – attitude statements, product or service attributes, image dimensions, etc. Respondents are then asked to position how they feel about each one using a defined rating scale.
A rating scale is usually an interval scale (see Chapter 4) on which respondents are asked to give their answer using a range of evenly spaced points, which are provided as prompts.
Rating scales are widely used by questionnaire writers. They provide a straightforward way of asking attitudinal information that is easy and versatile to analyse, and that provides comparability across time. However, there are many different types of rating scales, and there is skill in choosing which is most appropriate for a given task.
All of the itemized rating scales given in Figure 5.1 are from actual surveys. The wording on each scale is tailored to be appropriate to the question, and all have five points representing a gradation from positive to negative. The first two are balanced around a neutral mid-point with equal numbers of positive and negative statements for the respondent to choose from.
Being interval data, scores can be allocated to each of the responses to assist in the analysis of responses. The allocated scores are most likely to be from 1 to 5, from the least to the most positive, or from -2 to +2, from the most negative to the most positive with the neutral point as zero.
In all of these examples the scales presented to respondents run from the most positive to the most negative or, if rotated, from the most negative to the most positive for half of the respondents. It is usual to present the responses in this way for clarity and to assist the respondent to find the most appropriate answer.
However, there are occasions when there is a reason for an alternative order that overrides this. Consider Figure 5.2. This is from an Australian web-based survey, and the questionnaire writer has placed the mid-scale neutral statement at the end of the list offered because of the subject matter. This is because there is a tendency for respondents to deny being influenced by advertising, or even to acknowledge to themselves that they are influenced. The neutral statement has been placed last in the list in the expectation that, by offering the four statements that acknowledge advertising influence together as a block, the visual impact will be such that respondents will be more prepared to consider that they may be influenced. The questionnaire writer has tried to bias the responses, but is doing so in order to offset another known bias. When scoring the responses, the researcher must remember that the mid-point score must be given to the last statement in the list.
1. Balanced scales
It is usual to balance scales by including equal numbers of positive and negative attitudes. If there are more positive than negative attitudes offered, then the total number of positive responses tends to be higher than would have otherwise been the case.


Consider the balanced scale when asking respondents to describe the taste of a product:
Very good
Good
Average Poor
Very poor
With two positive and two negative statements the respondents are not led in either direction. However, if the scale was:
Excellent
Very good
Good
Average Poor
then the three positive dimensions would tend to be chosen more often. In most circumstances, it is important to balance the scale in order to avoid this bias.
However, there are occasions when an unbalanced scale can be justified. Where it is known that the response will be overwhelmingly in one direction, then more categories may be given in that direction to achieve better discrimination.
An example is frequently found when measuring the importance of service in customer satisfaction research. When asked to state how important various aspects of customer service are, few customers say that any are unimportant. After all, the customers will be looking for the best service that they can get. And the dimensions about which we ask are the ones that we believe are important anyway. The objective is mainly to distinguish between the most important aspects of service and the less important ones. An unbalanced scale might therefore be used, offering just one unimportant option, but several degrees of importance:
Extremely important
Very important
Important
Neither important nor unimportant
Not important
Here the questionnaire writer is trying to obtain a degree of discrimination between the levels of importance. The mid-point is ‘important’, and the scale implicitly assumes that this will be where the largest number of responses will be placed.
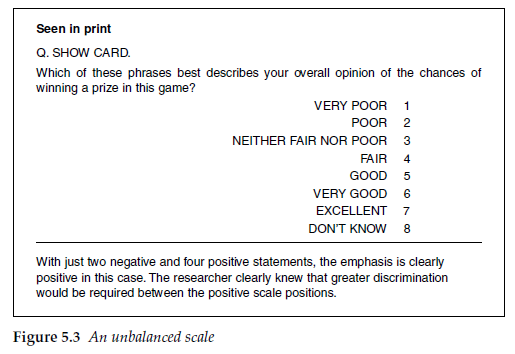
Unbalanced scales should only be used for a good reason and for a specific purpose, and by experienced researchers who know what the impact is likely to be (see Figure 5.3).
2. Number of points on the scale
The illustrations in Figures 5.1 and 5.2 show five-point scales, which are probably the most commonly used. A five-point scale gives sufficient discrimination for most purposes and is easily understood by respondents. The size of the scale can be expanded to seven points if greater discrimination is to be attempted. Then the scale points can be written as:
Extremely likely
Very likely
Quite likely
Neither likely nor unlikely
Quite unlikely
Very unlikely
Extremely unlikely
or:
Excellent
Very good
Good
Neither good nor poor
Poor
Very poor
Extremely poor
There is little agreement as to the optimum number of points on a scale. The only agreement is that it is between five and 10. Seven is considered the optimal number by many researchers (Krosnick and Fabrigar, 1997) but there is a range of opinions on this issue and whether extending the number to 10 or more increases the validity of the data. More recently, Coelho and Esteves (2007) have demonstrated that a 10-point numeric scale is better than a five-point scale in that it transmits more of the available information, without encouraging response error: the definition given by Cox (1980) for assessing the optimum number of points. They hypothesize that, amongst other things, consumers may be more used these days to giving things scores out of 10 and are able to cope with them better than was the case 20 years ago.
The questionnaire writer’s decision as to the number of points on the scale has to be taken with regard to the distinction that is possible between the points, the ability of respondents to discriminate between those points, and the degree of discrimination that is sought. The interview medium must also be considered. With telephone interviewing, scales with more than five points are difficult for respondents to remember. With self-completion questionnaires, the additional page space required for more points may be a factor.
3. ‘Don’t knows’
In Figure 5.1, each of the scales is balanced around a neutral mid-point ‘Neither agree nor disagree’. This is included to allow a response for people who have no strong view either way. This is frequently the case when the subject is groceries or other everyday objects. However, this point is also frequently used by respondents who wish to give a ‘Don’t know’ response, but are not offered ‘Don’t know’ as a response category and do not wish to, or are unable to, leave the response blank. The reluctance of respondents to leave a scale blank where they genuinely cannot give an answer has always been an issue with self-completion interviews, or where these scales form a self-completion section to an otherwise interviewer-administered interview. However, electronic interviews frequently do not allow respondents to pass to the next question if any line is left blank. Thus for CAPI, CATI and particularly web-based interviews, distinguishing between genuine mid-point responses and ‘Don’t knows’ can become a serious issue.
‘Don’t know’ codes or boxes are frequently not provided, as the questionnaire writer does not wish to encourage this as a response but to encourage the respondent to provide a response that, in all likelihood, reflects an attitude unrecognized at a conscious level by the respondent. Also, non-response to one scale among a battery of scales can raise issues of how to treat the data when using certain data analysis techniques. The reluctance to accept ‘Don’t know’ as a response is understandable. The questionnaire writer must consider whether it is preferable to be able to distinguish or not between genuine mid-point responses and people who did not want to, or could not, answer.
4. Odd or even number of points
Some practitioners prefer to use a scale with an even number of points. They eliminate the neutral mid-point in an attempt to force those who would otherwise choose it to give an inclination one way or the other. The response points for a six-point agree-disagree scale could be:
Extremely likely
Very likely
Quite likely
Quite unlikely
Very unlikely
Extremely unlikely
or:
Excellent
Very good
Good Poor
Very poor
Extremely poor
In studies where it would be expected that most people would have a view, for example studies about crime, it can be argued that most people hold a view even if they do not recognize that they do. It is therefore legitimate, it is argued, to force a response in one direction or the other. When the subject is breakfast cereals, though, it must be recognized that many people may really have no opinion one way or the other.
It is possible to accept a neutral response if that is offered spontaneously by the respondent in an interviewer-administered survey. Studies have shown, though, that including a neutral scale position significantly increases the number of neutral responses compared to accepting them spontaneously (Kalton, Roberts and Holt, 1980; Presser and Schuman, 1980). This indicates that eliminating the middle neutral point does increase the commitment of respondents to be either positive or negative. This is supported by Coelho and Esteves (2007), who found that the mid-point was used by respondents who are trying to reduce the effort, and so exaggerated the true mid-point score, and by Saris and Gallhofer (2007) who showed that not providing a neutral mid-point improves both the reliability and the validity of the data. However, midpoints continue to be widely used and the questionnaire writer must decide whether or not including one is appropriate for the particular question and subject matter. Other factors, such as precedence and comparability with other data, will often be the deciding factor.
Source: Brace Ian (2018), Questionnaire Design: How to Plan, Structure and Write Survey Material for Effective Market Research, Kogan Page; 4th edition.
My relatives always say that I am killing my time here
at web, however I know I am getting knowledge all the time by reading thes good content.