A number of forms of rating scale have been developed specifically to address responses to a series of attitudinal dimensions. The three most commonly used are:
- Likert scale;
- semantic differential scale;
- Stapel scale.
1. Likert scale
The Likert scale (frequently known as an ‘agree-disagree’ scale) was first published by psychologist Rensis Likert in 1932. The technique presents respondents with a series of attitude dimensions (a battery), for each of which they are asked whether, and how strongly, they agree or disagree, using one of a number of positions on a five-point scale (see Figure 5.4).
With face-to-face interviewer-administered scale batteries, the responses may be shown on a card whilst the interviewer reads out each of the statements in turn. With telephone interviewing, the respondent may sometimes be asked to remember what the response categories are, but preferably would be asked to write them down.
The technique is easy to administer in self-completion questionnaires, either paper or electronic, and may often be given to respondents as a self-completion section in an interviewer-administered survey.
Responses using the Likert scale can be given scores for each statement, usually from 1 to 5, negative to positive, or -2 to +2. As these are interval data, means and standard deviations can be calculated for each statement.
The full application of the Likert scale is then to sum the scores for each respondent to provide an overall attitudinal score for each individual. Likert’s intention was that the statements would represent different aspects of the same attitude. The overall score, though, is rarely calculated in commercial research (Albaum, 1997), where the statements usually cover a range of attitudes. The responses to individual statements are of more interest in determining the specific aspects of attitude that drive behaviour and choice in a market, or summations are made over small groups of items. The data will tend to be used in factor analysis, in order to identify groups of attitudinal statements that have similar response patterns and that could therefore represent underlying attitudi- nal dimensions. Factor analysis can be used to create a factor score for each respondent on each of the underlying attitudinal dimensions, thereby reducing the data to a small number of individual scores. These data are then often used in various forms of cluster or segmentation analyses, in order to segment the data into groups of respondents with similar attitudes.
There are four interrelated issues that questionnaire writers must be aware of when using Likert scales:
- order effect;
- acquiescence;
- central tendency;
- pattern answering.

The order effect arises from the order in which the response codes are presented. It has been shown (Artingstall, 1978) that there is a bias to the left on a self-completion scale. (Order effects are returned to in Chapter 7.)
Acquiescence is the tendency for respondents to say ‘yes’ to questions or to agree rather than disagree with statements (Kalton and Schuman, 1982). This is also known as ‘yea saying’.
In Figure 5.4, the negative end of the scale is placed to the left, to be read first. With the ‘Agree’ response to the left, the order effect and acquiescence would compound each other. With the ‘Disagree’ response to the left, there is a possibility of the biases going some way to cancelling each other.
Central tendency is the reluctance of respondents to use extreme positions. It has been shown (Albaum, 1997) that a two-stage question elicits a higher proportion of extreme responses. This work used the question:
For each of the statements listed below indicate first the extent of your agreement and second how strongly you feel about your agreement.
‘A product’s price will usually reflect its level of quality.’ agree _ neither agree nor disagree _ disagree_
How strongly do you feel abut your response? very strong_ not very strong_
The question arises, of course, as to whether the two-stage approach is a better measure of the attitude or whether it creates its own bias towards the extreme points. Albaum et al (2007) explored this issue by correlating reported attitude to actual behaviour in the area of charity giving. The results were not conclusive but suggested that the two-stage approach provides the truer reflection of attitudes.
With a large number of dimensions to be evaluated, this approach may be too time-consuming for most studies, but the questionnaire writer should be aware of this approach and of the different response patterns that it is likely to give. This approach is particularly appropriate for telephone interviewing, where the complete scale cannot be shown.
Pattern answering occurs when a respondent falls into a routine of ticking boxes in a pattern, which might be straight down the page or diagonally across it. It is often a symptom of fatigue or boredom. The best way to avoid it is to keep the interview interesting for the respondent. To minimize pattern answering, both positive and negative statements should be included. The respondent then has to read them or listen to them carefully in order to understand the polarity and to give consistent answers. Conflicting answers from the same respondent will identify where pattern answering has occurred.
2. Semantic differential scale
The semantic differential scale is a bipolar rating scale. It differs from the Likert scale in that opposite statements of the dimension are placed at the two ends of the scale and respondents are asked to indicate which they most agree with by placing a mark along the scale. This has the advantage that there is then no need for the scale points to be semantically identified. Any bias towards agreeing with a statement is avoided, as both ends of the scale have to be considered.
The original development of this scale by Osgood (Osgood, Suci and Tannenbaum, 1957) recommended the use of seven points on the response scale, and this number continues to be the favourite of researchers (McDaniel and Gates, 1993), although both five-point scales and three- point scales are used for particular purposes (Oppenheim, 1992).
With semantic differential scales the statements should be kept as short and precise as possible because of the need for the respondent to read and understand fully both ends of the scale. Attitudes can be difficult to express concisely, and it is sometimes difficult to find an opposite to ensure that the scale represents a linear progression from one end to the other. For these reasons semantic differential scales are usually better suited to descriptive dimensions.
As with all self-completion techniques it is wise to provide an example of how to complete the grid (see Figure 5.5).
Care must be taken to ensure that the two statements provided determine the dimension that the researcher requires. The opposite of ‘modern’ might be ‘old-fashioned’ or it might be ‘traditional’. The opposite of ‘sweet’ might be ‘savoury’ or ‘sour’ or ‘bitter’. This forces the questionnaire writer to consider exactly what the dimension is that is to be measured. This gives the semantic differential scale an advantage over the Likert scale where disagreeing with ‘The brand is modern’ could mean that the brand is seen as either old-fashioned or traditional, and the researcher does not know which.
Some dimensions may have no opposite other than a negative statement of the attribute. The true opposite of ‘fattening’ applied to a food product would be ‘slimming’, but it is likely that the neutral ‘not fattening’ would make more sense in assessing perceptions of the product.

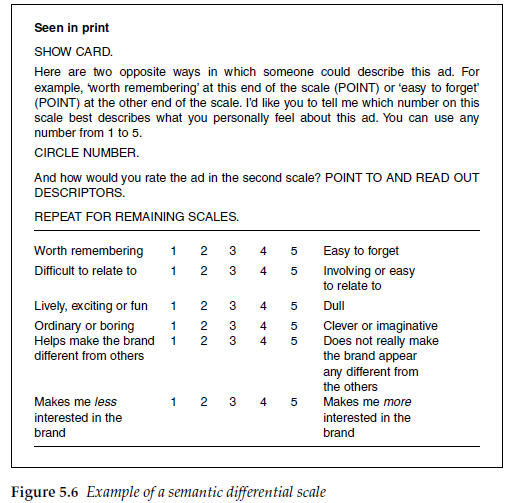
Figure 5.6 comes from an advertising study. Note that the questionnaire writer has reversed the polarity of the statements alternately. The statements have been shown to the respondent on a card. So although this is not a self-completion questionnaire, there is still a danger of pattern answering, which needs to be minimized.
Also note the difficulty that the questionnaire writer has in achieving exact opposites in the first pair of statements. The ad may be worth remembering because it contains useful information, but that does not necessarily mean that it is not also easily forgettable. The questionnaire writer could have included both of the pairs ‘Worth remembering – Not worth remembering’ and ‘Easy to forget – Difficult to forget’, but has chosen to force a decision between two statements that are not strictly opposites in order not to have to extend the number of pairs asked about.
As with the Likert scale, dimensions of similar meaning should be given with reversed polarity in order to minimize pattern answering and to check internal consistency of responses.
3. Stapel scale
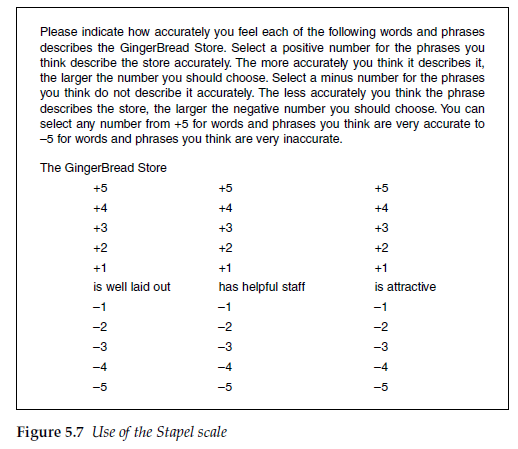
With the Stapel scale, named after Jan Stapel, the dimension or descriptor is placed at the centre of a scale that ranges from -5 to +5. Respondents are asked to indicate whether they agree positively or negatively with the statement, and how strongly, by selecting one of the points on the scale (see Figure 5.7).
The advantage of this type of scale over semantic differential scales is that it is not necessary to find an accurate opposite to each dimension to ensure bipolarity. The data can, however, be analysed in the same way as semantic differentials, and the scale, with 10 points, has the potential to provide greater discrimination than a five-point scale. By having no centre point, these scales also avoid the issue of whether or not there should be an odd or even number of points on the scale.
Stapel scales are, however, not widely used as they are thought to be confusing for respondents. They must be self-administered if the researcher is to be confident that the respondent has properly understood the task. This has limited their use in telephone interviewing and with much face-to-face interviewing. However, with imaginative layout, they could work well with online web-based interviewing.
4. Numeric scales
A simple form of scale is to ask respondents to award a score between 1 and 10, or between 0 and 10 if a mid-point is required, or even between 1 or 0 and 100. The end points of the scale should be verbally anchored.
Numeric scales are appropriate for measures such as importance, where the bottom point equates to ‘Not at all important’ and the top point to ‘Extremely important’ or similar. The researcher must remember, though, that this is an interval scale and not a ratio scale. A score of 8 out of 10 does not mean that something is twice as good or twice as important as a score of 4. These scales are not appropriate for a choice between two equally positive anchor points, such as a choice between two brands, because of the more positive associations implicit in the higher score, which would bias response towards that option.
As a technique this is more suited to self-completion questionnaires than to interviewer-administered interviews. With the self-completion survey, respondents can see their responses and reference their subsequent responses against them.
A write-in box (Figure 5.8), where the score is recorded, also takes up less space than a semantic or graphic scale. This is one reason why this type of numeric scale has become popular with writers of web-based questionnaires, as it allows more dimensions to be accommodated on a single screen.
Numeric write-in scales have been shown to produce different results from semantic scales despite purporting to measure the same thing and to use similar anchor points. Christian and Dillman (2004) demonstrated in a postal self-completion survey, that responses were consistently higher for the numeric answer box than for a semantic differential scale and for a polar point scale.
5. Graphic scales
A graphic scale is one presented to the respondents visually so that they can select a position on it that best represents their desired response. In its most basic form it is a continuous bi-polar scale with fixed points verbally anchored at either end. It can simply be a line between the two anchor points (see Figure 5.9). This is a form of graphic scale which has become known as a ‘visual analog scale’.

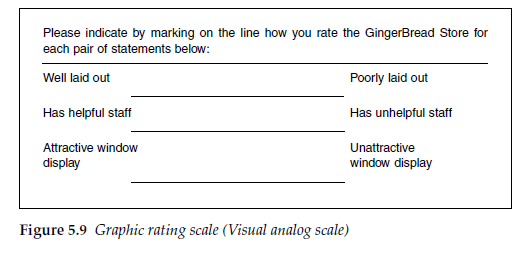
The distance from the end points of the respondent’s marks is measured to provide the score for each attitudinal dimension. Essentially this is a continuously rated semantic differential scale, which provides a greater degree of precision and avoids the issues of numbers of points on the scale. It is a simple way of measuring attitudes and image perceptions, but is impractical to use with paper questionnaires. Measuring the position marked on hundreds of paper questionnaires, with possibly dozens of scales on each one is not viable for most commercial projects. This technique cannot be used with telephone interviewing.
With CAPI interviewing, though, and to a greater degree with online web-based interviewing, the continuous graphic scale is a realistic option. Respondents can drag a cursor along the line to the exact position that they want it, and that position is then automatically recorded.
When the technique is being used to measure attitudes to brands or products, as in Figure 5.10, more than one cursor can be used to represent different brands, or brand logos can be used in place of cursors. Then each respondent can place a number of brands along the scale, so that they are positioned relative to each other as well as to the scale ends, according to the respondent’s perceptions. This is quicker for respondents than rating each brand individually, is more interesting for them when logos are used, and provides better relative measures of the attitude variation between brands.
Although the data collected are continuous, the measurements will be assigned to categories and treated as interval data for analysis purposes. It is possible to have a large number of very small intervals, but the researcher must decide at what level the apparent accuracy of the data becomes spurious. That will depend on the length of the line used, the accuracy with which respondents are able to place the cursor, and the degree of accuracy to which respondents are likely to have tried to place the cursor.

The questionnaire writer may wish to apply labels to the scale. The scale can be labelled numerically, so that one end is 0 and the other 100. The position of the cursor can then be indicated as a number between 0 and 100, which allows the respondent to place the cursor accurately.
In some instances, a centre-point label might be added, for example if the technique is being used to evaluate reactions to a new product. This scale could have just the verbal descriptors (see Figure 5.11), or these could be combined with numeric values, either shown on the line or appearing with the cursor. Here a numeric scale would have a zero point at ‘Just right’ extending to -50 for each of the end points, as they always represent a move away from the preferred positioning. For further differentiation the line can be divided into segments that may assist respondents to determine where their desired response should be.
If each of the five segments is verbally anchored then this becomes a graphic rating scale, equivalent to an itemized rating scale such as a Likert scale. It does, however, have the advantage that there is variation within each of the scale points, and that variation can be measured and recorded.
It has been shown (Thomas et al, 2007) that in web-based online surveys respondents found visual analog scales (VAS) as easy to complete as rating scales using fixed points denoted by radio buttons, and that they felt that VAS scales conveyed their responses with sufficient accuracy better than with a numeric box entry. Responses obtained from VAS and the fixed-point radio buttons were similar, and the respondents found the VAS approach more interesting than the radio buttons. As maintaining the interest and involvement of respondents is one of the objectives of the questionnaire writer, the use of VAS or graphic rating scales should always be considered as an alternative to radio buttons.

6. Pictorial scales
In many instances, it is desirable to avoid using semantic scales in favour of pictorial representations. This may be desirable:
- where the target population is children who are unable to relate their responses to verbal descriptors;
- where there are cultural differences between sub-groups of the target population that may mean that they interpret descriptors differently;
- with multi-country studies where translation of descriptors may alter shades of meaning;
- where there is a low level of literacy among the target population.
A common solution to this is the use of smiley or smiling face scales. A range of smiles and down-turned mouths is used to indicate that the respondent agrees with or is happy with the statement, or disagrees with or is unhappy with the statement (see Figure 5.12).
A pictorial version of the continuous rating scale is the thermometer scale. With this the respondent ‘colours in’ a depiction of a thermometer so that colouring to the top is positive and not colouring it is negative. As with other types of continuous scale it is difficult economically to measure and code responses, except with electronic self-completion questionnaires.

7. Anchor strength
With all semantic scales, the wording of the ‘anchor statement’ is crucial to the distribution of data that is likely to be achieved. A five-point bipolar scale that goes from ‘Extremely satisfied’ to ‘Extremely dissatisfied’ is likely to discourage respondents from using the end points and to concentrate the distribution on the middle three points. If the end points were ‘Very satisfied’ and ‘Very dissatisfied’, the end points would be used by more respondents and the data would be more widely distributed across the scale. This can make the data more discriminatory between items.
As a general rule, the stronger the anchors, the more points are required on the scale to obtain discrimination.
Source: Brace Ian (2018), Questionnaire Design: How to Plan, Structure and Write Survey Material for Effective Market Research, Kogan Page; 4th edition.
Pretty nice post. I just stumbled upon your weblog and wanted to say that I’ve really enjoyed browsing your blog posts.
After all I’ll be subscribing to your feed and I hope you write again very soon!