We review measuring the effectiveness of e-commerce system in detail since it is a key part of managing an e-commerce initiative. Often a large investment will have been made in the site and senior managers will want to ensure that the investment is delivering its objectives. They will also want to find and rectify problems with the site or exploit approaches that are working well. We focus on measurement of sell-side e-commerce, since the approach is most advanced for this sector, but the principles and practice can be readily applied to other types of e-business system such as intranets and extranets.
Companies that have a successful approach to e-commerce often seem to share a common characteristic. They attach great importance and devote resources to monitoring the success of their online marketing and putting in place the processes to continuously improve the performance of their digital channels. This culture of measurement is visible in the UK bank Alliance and Leicester, which in 2004 reported that they spent over 20% of their £80 million marketing communications budget on online marketing. Stephen Leonard, head of e-commerce, described their process as ‘Test, Learn, Refine’ (Revolution, 2004). Graeme Findlay, senior manager, customer acquisition of e-commerce at A&L, explains further: ‘Our online approach is integrated with our offline brand and creative strategy, with a focus on direct, straightforward presentation of strong, value-led messages. Everything we do online, including creative, is driven by an extensive and dynamic testing process’ Seth Romanow, Director of Customer Knowledge at Hewlett-Packard, speaking at the 2004 E-metrics summit, described their process as ‘Measure, Report, Analyse, Optimize’. Amazon refers to its approach as ‘The Culture of Met-rics’ (see Case Study 12.1). Jim Sterne, who convenes an annual event devoted to improving online performance (www.emetrics.org), has summarized his view on the required approach in his book Web Metrics (Sterne, 2002) as ‘TIMITI’ which stands for ‘Try It! Measure It! Tweak It!’, i.e. online content should be reviewed and improved continuously rather than as a periodic or ad hoc process. The importance of defining an appropriate approach to measurement and improvement is such that the term ‘web analytics’ has developed to describe this key Internet marketing activity. A web analytics association (www.webanalyticsassociation.org) has been developed by vendors, consultants and researchers in this area. Eric Petersen (2004), an analyst specializing in web analytics, defines it as follows:
Web analytics is the assessment of a variety of data, including web traffic, web-based transactions, web server performance, usability studies, user submitted information [i.e. surveys], and related sources to help create a generalised understanding of the visitor experience online.
You can see that in addition to what are commonly referred to as ‘site statistics’ about web traffic, sales transactions, usability and researching customers’ views through surveys are also included. We believe, though, that the definition can be improved further – it suggests analysis for the sake of it – whereas the business purpose of analytics should be emphasized. The definition could also refer to comparison of site visitor volumes and demographics relative to competitors using panels and ISP collected data. Our definition is:
Web analytics is the customer-centred evaluation of the effectiveness of Internet-based marketing in order to improve the business contribution of online channels to an organisation.
A more recent definition from the Web Analytics Association (WAA, www. webanalyticsassociation.org) in 2005 is:
Web Analytics is the objective tracking, collection, measurement, reporting and analysis of quantitative Internet data to optimize websites and web marketing initiatives.
1. Principles of performance management and improvement
To improve results for any aspect of any business, performance management is vital. As Bob Napier, Chief Information Officer, Hewlett-Packard, was reported to have said back in the 1960s,
You can’t manage what you can’t measure.
The processes and systems intended to monitor and improve the performance of an organization and specific management activities such as Internet marketing are widely known as ‘performance management systems’ and are based on the study of performance measurement systems.
Although we have stated that measurement is an important part of maintaining a web site, it is worth noting that the reality is that measurement is often neglected when a web site is first created. Measurement is often highlighted as an issue once early versions of a site have been ‘up and running’ for a few months or even years, and employees start to ask questions such as ‘How many customers are visiting our site, how many sales are we achieving as a result of our site and how can we improve the site to achieve a return on investment? The consequence of this is that performance measurement is something that is often built into an online presence retrospectively. Of course, it is preferable if measurement is built into site management from the start since then a more accurate approach can be developed and it is more readily possible to apply a technique known as ‘design for analysis’ (DFA). Here, the site is designed so companies can better understand the types of audience and their decision points. For example, for Dell (www.dell.com), the primary navigation on the home page is by business type. This is a simple example of DFA since it enables Dell to estimate the proportion of different audiences to their site and at the same time connect them with relevant content. Other examples of DFA include:
- Breaking up a long page or form into different parts, so you can see which parts people are interested in.
- A URL policy used to recommend entry pages for printed material.
- Group content by audience type or buying decision and setting up content groups of related content within web analytics systems.
- Measure attrition at different points in a customer journey, e.g. exit points on a five-page buying cycle.
In this section, we will review approaches to performance management by examining three key elements of an e-commerce performance improvement system. These are, first, the process for improvement, secondly, the measurement framework which specifies groups of relevant Internet marketing metrics and, finally, an assessment of the suitability of tools and techniques for collecting, analysing, disseminating and actioning results. We will review three stages of creating and implementing a performance management system.
2. Stage 1: Creating a performance management system
The essence of performance management is suggested by the definition for performance measurement used by Andy Neely of Cranfield School of Management’s Centre for Business Performance. He defines (Neely etal., 2002) performance measurement as
the process of quantifying the efficiency and effectiveness of past actions through acquisition, collation, sorting, analysis, interpretation and dissemination of appropriate data.
Performance management extends this definition to the process of analysis and actioning change in order to drive business performance and returns. Online marketers can apply many of the approaches of business performance management to Internet marketing. As you can see from the definition, performance is measured primarily through information on process effectiveness and efficiency as introduced in Chapter 5 in the section on objective setting where we noted that it is important to include both effectiveness and efficiency measures.
The need for a structured performance management process is clear if we examine the repercussions if an organization does not have one. These include: poor linkage of measures with strategic objectives or even absence of objectives; key data not collected; data inaccuracies; data not disseminated or analysed; or no corrective action. Many of the barriers to improvement of measurement systems reported by respondents in Adams et al. (2000) also indicate the lack of an effective process. The barriers can be grouped as follows:
- senior management myopia – performance measurement not seen as a priority, not understood or targeted at the wrong targets – reducing costs rather than improving performance;
- unclear responsibilities for delivering and improving the measurement system;
- resourcing issues – lack of time (perhaps suggesting lack of staff motivation), the necessary technology and integrated systems;
- data problems – data overload or of poor quality, limited data for benchmarking.
To avoid these pitfalls, a coordinated, structured measurement process such as that shown in Figure 12.5 is required. Figure 12.5 indicates four key stages in a measurement process. These were defined as key aspects of annual plan control by Kotler (1997). Stage 1 is a goal-setting stage where the aims of the measurement system are defined – this will usually take the strategic Internet marketing objectives as an input to the measurement system. The aim of the measurement system will be to assess whether these goals are achieved and specify corrective marketing actions to reduce variance between target and actual key performance indicators. Stage 2, performance measurement, involves collecting data to determine the different metrics that are part of a measurement framework as discussed in the next section. Stage 3, performance diagnosis, is the analysis of results to understand the reasons for variance from objectives (the ‘performance gap’ of Friedman and Furey, 1999) and selection of marketing solutions to reduce variance. The purpose of Stage 4, corrective action, according to Wisner and Fawcett (1991), is to identify competitive position, locate problem areas, assist the firm in updating strategic objectives and making tactical decisions to achieve these objectives and supply feedback after the decisions are implemented.
In an Internet marketing context, corrective action is the implementation of these solutions as updates to web-site content, design and associated marketing communications. At this stage the continuous cycle repeats, possibly with modified goals. Bourne et al. (2000) and Plant (2000) suggest that in addition to reviewing objectives, the suitability of the metrics should also be reviewed and revised.
Measurement is not something that can occur on an ad hoc basis because if it is left to the individual they may forget to collect the data needed. A ‘measurement culture’ is one in which each employee is aware of the need to collect data on how well the company is performing and on how well it is meeting its customers’ needs.
3. Stage 2: Defining the performance metrics framework
Measurement for assessing the effectiveness of Internet marketing can be thought of as answering these questions:
- Are corporate objectives identified in the Internet marketing strategy being met?
- Are marketing objectives defined in the Internet marketing strategy and plan achieved?
- Are marketing communications objectives identified in the Internet marketing plan achieved?
- How efficient are the different promotional techniques used to attract visitors to a site?
These measures can also be related to the different levels of marketing control specified by Kotler (1997). These include strategic control (question 1), profitability control (question 1), annual-plan control (question 2) and efficiency control (question 3).
Efficiency measures are more concerned with minimizing the costs of online marketing while maximizing the returns for different areas of focus such as acquiring visitors to a web site, converting visitors to outcome or achieving repeat business.
Chaffey (2000) suggests that organizations define a measurement framework which defines groupings of specific metrics used to assess Internet marketing performance. He suggests that suitable measurement frameworks will fulfil these criteria:

A) Include both macro-level effectiveness metrics which assess whether strategic goals are achieved and indicate to what extent e-marketing contributes to the business (revenue contribution and return on investment). This criterion covers the different levels of marketing control specified by Kotler (1997) including strategic control, profitability control and annual-plan control.
B) Include micro-level metrics which assess the efficiency of e-marketing tactics and implementation. Wisner and Fawcett (1991) note that typically organizations use a hierarchy of measures and they should check that the lower-level measures support the macro-level strategic objectives. Such measures are often referred to as performance drivers, since achieving targets for these measures will assist in achieving strategic objectives. E-marketing performance drivers help optimize e-marketing by attracting more site visitors and increasing conversion to desired marketing outcomes. These achieve the marketing efficiency control specified by Kotler (1997). The research by Agrawal etal. (2001), who assessed companies on metrics defined in three categories of attraction, conversion and retention as part of an e-performance scorecard, uses a combination of macro- and micro-level metrics.
C) Assess the impact of the e-marketing on the satisfaction, loyalty and contribution of key stakeholders (customers, investors, employees and partners) as suggested by Adams etal. (2000).
D) The framework must be flexible enough to be applied to different forms of online presence whether business-to-consumer, business-to-business, not-for-profit or transactional e-tail, CRM-oriented or brand-building. Much discussion of e-marketing measurement is limited to a transactional e-tail presence. Adams et al. (2000) note that a ‘one-size-fits-all’ framework is not desirable.
E) Enable comparison of performance of different e-channels with other channels as suggested by Friedman and Furey (1999).
F) The framework can be used to assess e-marketing performance against competitors’ or out-of-sector best-practice.
When identifying metrics it is common practice to apply the widely used SMART mnemonic and it is also useful to consider three levels – business measures, marketing measures and specific Internet marketing measures (see objective setting section in Chapter 5).
Chaffey (2000) presents a framework of measures, shown in Figure 12.6, which can be applied to a range of different companies. Metrics for the categories are generated as objectives from Internet marketing planning which then need to be monitored to assess the success of strategy and its implementation. Objectives can be devised in a top-down fashion, starting with strategic objectives for business contribution and marketing outcomes leading to tactical objectives for customer satisfaction, behaviour and site promotion. An alternative perspective is bottom-up – success in achieving objectives for site promotion, on-site customer behaviour and customer satisfaction lead sequentially to achieving objectives for marketing outcomes and business contribution.

- Channel promotion
Channel-promotion measures consider where the web site users originate – online or offline, and what are the sites or offline media that have prompted their visit. Log file analysis can be used to assess which intermediary sites customers are referred from and even which keywords they typed into search engines when trying to locate product information. Promotion is successful if traffic is generated that meets objectives of volume and quality. Quality will be determined by whether visitors are in the target market and have a propensity for the service offered (conversion rates for different referrers). Overall hits or page views are not enough – inspection of log files for companies shows that a high proportion of visitors get no further than the home page! Differences in costs of acquiring customers via different channels also need to be assessed.
Key measure: referral mix. For each referral source such as offline or banner ads online it should be possible to calculate:
-
- % of all referrals (or visitors);
- cost of acquisition (CPA) or cost per sale (CPS);
- contribution to sales or other outcomes.
- Channel buyer behaviour
Once customers have been attracted to the site we can monitor content accessed, when they visit and how long they stay, and whether this interaction with content leads to satisfactory marketing outcomes such as new leads or sales. If visitors are incentivized to register on-site it is possible to build up profiles of behaviour for different segments. It is also important to recognize return visitors for whom cookies or log-in are used.
Key measures are:
Bounce rates for different pages, i.e. proportion of single page visits
Home page views/all page views, e.g. 20% = (2,358/11,612)
Stickiness: Page views/visitor sessions, e.g. 6 =11,612/2,048
Repeats: Visitor sessions/visitors, e.g. 2 = 2,048/970.
- Channel satisfaction
Channel satisfaction with the online experience is vital in achieving the desired channel outcomes, although it is difficult to set specific objectives. Online methods such as online questionnaires, focus groups and interviews can be used to assess customers’ opinions of the web site content and customer service and how it has affected overall perception of brand.
Key measure: channel satisfaction indices. These are discussed in Chapter 8 and include ease of use, site availability and performance, and e-mail response. To compare customer satisfaction with other sites, benchmarking services can be used.
Benchmarking services such as Foresee (www.foreseeresults.com) based on the American Customer Satisfaction Index methodology are published for some industries. These assess scores based on the gap between expectations and actual service.
- Channel outcomes
Traditional marketing objectives such as number of sales, number of leads, conversion rates and targets for customer acquisition and retention should be set and then compared to other channels. Dell Computer (www.dell.com) records on-site sales and also orders generated as a result of site visits, but placed by phone. This is achieved by monitoring calls to a specific phone number unique to the site.
Key measure: channel contribution (direct and indirect).
A widely used method of assessing channel outcomes is to review the conversion rate, which gives an indication of the percentage of site visitors who take a particular outcome. For example:
Conversion rate, visitors to purchase = 2% (10,000 visitors, of which 200 make purchases).
Conversion rate, visitors to registration = 5% (10,000 visitors, of which 500 register).
A related concept is the attrition rate which describes how many visitors are lost at each stage of visiting a site. Figure 12.7 shows that for a set time period, only a proportion of site visitors will make their way to product information, a small proportion will add an item to a basket and a smaller proportion still will actually make the purchase. A key feature of e-commerce sites is that there is a high attrition rate between a customer’s adding an item to a basket and subsequently making a purchase. Online marketers work to decrease this ‘shopping basket abandonment rate’ through improving usability and modifying messaging to persuade visitors to continue the ‘user journey’.
- Channel profitability
A contribution to business profitability is always the ultimate aim of e-commerce. To assess this, leading companies set an Internet contribution target of achieving a certain proportion of sales via the channel. When easyJet (www.easyjet.com) launched its e-commerce facility in 1998, it set an Internet contribution target of 30% by 2000. They put the resources and communications plan in place to achieve this and their target was reached in 1999. Assessing contribution is more difficult for a company that cannot sell products online, but the role of the Internet in influencing purchase should be assessed. Discounted cash flow techniques are used to assess the rate of return over time. Service contribution from e-channels should also be assessed.

Multi-channel evaluation
The frameworks we have presented in this chapter are explained in the context of an individual channel, but with the contribution of the channel highlighted as % sales or profitability. But, as Wilson (2008) has pointed out, there is a need to evaluate how different channels support each other. Wilson says:
Traditional metrics have been aligned to channels, measuring resource input or leads in at one end and the value of sales generated by the channel at the other end. For companies that have been operating in a single channel environment, this might have been relatively efficient – but it no longer works when the organisation diversifies to a multichannel approach.
He suggests the most important aspect of multi-channel measurement is to measure ‘channel cross-over effects’. This involves asking, for example: ‘How can the impact of a paid search campaign be measured if it is as likely to generate traffic to a store, sales force or call centre as to a website? How can the impact of a direct mail campaign be tracked if it generates website traffic as well as direct responses’?
ItolMedia (2008) summarize recommendations by Forrester (unpublished at time of writing) which are:
- Total number of hybrid customers. These include the number and proportion who research online and purchase offline.
- Distribution and spend levels of those hybrid customers. Proportion, average order value and type of category spend for these customers.
- Cross-channel conversion. For example, online researchers who buy offline and potentially vice versa.
- Customer spend with competitors by channel. This would have to be established by primary research for each brand. Audience measurement services such as Hitwise will give information on share of search, share of visitors and upstream/downstream patterns of visitors
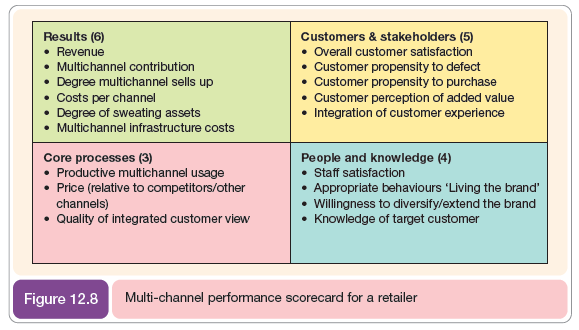
An example of a balanced scorecard style dashboard developed to assess and compare channel performance for a retailer is presented in Figure 12.8.
4. Stage 3: Tools and techniques for collecting metrics and summarizing results
Techniques to collect metrics include the collection of site-visitor activity data such as that collected from site log-files, the collection of metrics about outcomes such as online sales or e-mail enquiries and traditional marketing research techniques such as questionnaires and focus groups which collect information on the customer’s experience on the web site. We start by describing methods for collecting site visitor activity and then review more traditional techniques of market research which assess the customer experience.
4.1. Collecting site-visitor activity data
Site-visitor activity data captured in web analytics systems records the number of visitors on the site and the paths or clickstreams they take through the site as they visit different content. There is a wide variety of technical terms to describe these activity data which Internet marketers need to be conversant with.
Traditionally this information has been collected using a log-file analysis web analytics tool. The server-based log file is added to every time a user downloads a piece of information (a hit) and is analysed using a log-file analyser as illustrated by Figure 3.7. Examples of transactions within a log file are:
www.davechaffey.com – [05/0ct/2006:00:00:49 -000] “GET/index.htmlHTTP/1.0”200 33362
www.davechaffey.com – [05/Oct/2006:00:00:49 -000] “GET/logo.gif HTTP/1.0”200 54342
Despite their wide use in the media, hits are not a useful measure of web site effectiveness since if a page consists of 10 graphics, plus text, this is recorded as 11 hits. Page impressions or page views and unique visitors are better measures of site activity. Auditing companies such as ABC electronic (www.abce.org.uk) that audit sites for the purpose of proving the number of visitors to a site to advertisers use unique visitors and page impression as the main measures.

An example of visitor volume to a web site using different measures based on real, representative data for one month is presented in Figure 12.9. You can see how hits are much higher than page views and unique visitors and are quite misleading in terms of the ‘opportunities to see’ a message. We can also learn from the ratio between some of these measures – the figure indicates:
- Pages per visit (PPV) – the average number of pages viewed per visitor to a site (this is indicative of engagement with a site since the longer a visitor stays on a ‘sticky site’, the higher this value will be). PPV is a more accurate indication of stickiness than duration on a site in minutes since this figure is skewed upwards by visitors who arrive on a site and are inactive before their session times out at 30 minutes.
- Visits per (unique) visitor (VPV) – this suggests the frequency of site visits. Readers will realize that this value is dependent on the period that data are collected over. These data are reported for a month, during which time one would not expect many returning visitors. So it is often more relevant to present these data across a quarter or a year.
Other information giving detailed knowledge of customer behaviour that can be reported by any web analytics package include:
- Top pages;
- Entry and exit pages;
- Path or clickstream analysis showing the sequence of pages viewed;
- country of visitor’s origin (actually dependent on the location of their ISP);
- browser and operating system used;
- referring URL and domain (where the visitor came from).
4.2. Comparing apples to oranges?
With hundreds of different web analytics tools being used on different sites, it is important that there be standards for measuring visitor volumes. In particular, there are different techniques for measuring unique visitors which can be measured through IP addresses, but this is more accurate if it is combined with cookies and browser types. International standards bodies such as the IFABC (www.ifabc.org) and Web Analytics Association (www.webanalyticsassociation.org) and UK organizations such as ABC electronic (www.abce.org.uk) and JICWEBS (www.jicwebs.org) have worked to standardize the meaning of and data collection methods for different measures. See Table 12.5 or visit these sites for the latest precise definition of the terms in this section. Media buyers are particularly interested in accurate audited figures of media sites and organizations such as ABC electronic are important for this.

4.3. Collecting site outcome data
Site outcome data refer to a customer performing a significant action which is of value to the marketer. This is usually a transaction that is recorded. It involves more than downloading of a web page, and is proactive. Key marketing outcomes include:
- registration to site or subscriptions to an e-mail newsletter;
- requests for further information such as a brochure or a request for a callback from a customer service representative;
- responding to a promotion such as an online competition;
- a sale influenced by a visit to the site;
- a sale on-site.
When reviewing the efficiency of different e-communications tools referred to in Chapter 9, such as search engine marketing, online advertising and affiliate marketing it is important to assess the outcomes generated. Measuring quantity of clickthroughs to a site is simplistic, it is conversion to these outcomes which should be used to assess the quality of traffic. To achieve this ‘end-to-end’ tracking, two main tools are used: first, using cookies to identify the visitor across different sessions and, secondly, using tracking IDs within URLs to identify a user session.
An important aspect of measures collected offline is that the marketing outcomes may be recorded in different media according to how the customer has performed mixed-mode buying. For example, a new customer enquiry could arrive by e-mail, fax or phone. Similarly, an order could be placed online using a credit card, or by phone, fax or post. In both these instances what we are really interested in is whether the web site influenced the enquiry or sale. This is a difficult question to answer unless steps are put in place to answer it. For all contact points with customers staff need to be instructed to ask how they found out about the company, or made their decision to buy. Although this is valuable information it is often intrusive, and a customer placing an order may be annoyed to be asked such a question. To avoid alienating the customer, these questions about the role of the web site can be asked later, perhaps when the customer is filling in a registration or warranty card. Another device that can be used to identify use of the web site is to use a specific phone number on the web site, so when a customer rings to place an order, it is known that the number was obtained from the web site. This approach is used by Dell on its site.
It will be apparent that to collect some of these measures we may need to integrate different information systems. Where customers provide details such as an e-mail address and name in response to an offer, these are known as ‘leads’ and they may need to be passed on to a direct-sales team or recorded in a customer relationship management system. For full visibility of customer behaviour, the outcomes from these systems need to be integrated with the site-visitor activity data.
4.4. Selecting a web analytics tool
There is a bewildering range of hundreds of web analytics tools varying from shareware packages with often primitive reporting through to complex systems which may cost hundreds of thousands of dollars a year for a popular site. Given this, it is difficult for the Internet marketer to select the best tool or tools to meet their needs. One of the first issues to consider is the different types of measures that need to be integrated within the performance management system. Figure 12.10 gives an indication of the types of data that need to be integrated which include:
1 Operational data. Data would be ideally collected and reported within a single tool at this level, but unfortunately to obtain the best reporting it is often necessary to resort to four different types of tools or data source:
- Referrer data from acquisition campaigns such as search marketing or online advertising. Separate tools are often also required for retention e-mail marketing.
- Site-centric data about visitor volume and clickstream behaviour on the web site.
- Customer response and profile data.
- Transactional data about leads and sales which are often obtained from separate legacy systems.
- Tactical data. These data are typically models of required response such as:
- Reach models with online audience share data for different demographic groupings from sources such as Hitwise and Netratings.
- Lifetime value models which are created to assess profitability of visitors to the site from different sources and so need to integrate with operational data.
- Strategic data. Performance management systems for senior managers will give the big picture presented as scorecards or dashboards showing the contribution of digital channels to the organization in terms of sales, revenue and profitability for different products. These data indicate trends and relative performance within the company and to competitors such that the Internet marketing strategy can be reviewed for effectiveness. The efficiency of the processes may be indicated, through, for example, the cost of acquisition of customers in different markets and their conversion and retention rates.
So an important requirement of a web analytics tool is that it should seek to integrate all these different data sources. The other main requirements of a web analytics tool to consider include:
- Reporting of marketing performance (many are technical tools which do not clearly report on results from a marketing perspective)
- Accuracy of technique
- Analysis tools
- Integration with other marketing information systems (export)
- Ease of use and configuration
- Cost, which often varies according to site visitor volumes and number of system users
- Suitability for reporting on e-marketing campaigns.
Many online tracking tools were originally developed to report on the performance of the site and the pages accessed rather than specifically to report on e-marketing campaigns. It is there-fore important that companies have an excellent campaign reporting capability. When online marketers are reviewing the capability of tools, they should be able to answer these questions:

- Can the tool track through to point entry on site through to outcome such as site registration or sale? For example, to outcomes such as registration, lead or sale? Integration with data to reflect actual leads or sales in a legacy system should also be reported.
- Can the tool track and compare a range of online media types? These were explained in Chapter 8, for example, interactive (banner) ads, affiliates, e-mail marketing natural and paid search.
- Can return-on-investment models be constructed? For example, by entering costs and profitability for each product?
- Can reports be produced at both a detailed level and a summary level? This enables comparison of performance for different campaigns and different parts of the business.
- Capability to track clickthroughs at an individual respondent level for e-mail campaigns. This is important for follow-up marketing activities such as a phone call, direct mail or e-mail after an e-mail list member has expressed interest in a product through clicking on a promotion link.
- Are post-view responses tracked for ads? Cookies can be used to assess visitors who arrive on the site at a later point in time, rather than immediately.
- Are post-click responses tracked for affiliates? Similarly, visitors from affiliates may buy the product not on their first visit, but on a later visit.
- Do e-mail campaign summaries give unique clicks as well as total clicks? If an e-mail communication such as a newsletter contains multiple links, then total clicks will be higher.
- Is real-time reporting available? Is immediate access to campaign performance data available (this is usually possible with browser or tag-based campaign tracking solutions)?
- Is cross-campaign and cross-product or content reporting available? Is it readily possible to compare campaigns and sales levels across different products or different parts of the site rather than an aggregate?
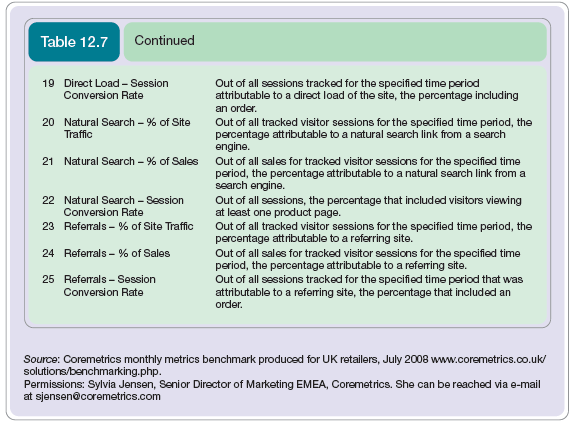
Accuracy is another an important aspect of web analytics tool and managers need to be aware of some of the weaknesses of web analytics tools based on log-file analysis. Perhaps the worst problems are the problems of under-counting and over-counting. These are reviewed in Table 12.6.

A relatively new approach to the problems of under-counting and over-counting of server-based log-file analysis described in Table 12.6is to use the alternative browser-based or tag-based measurement system that records access to web pages every time a page is loaded into a user’s web browser through running a short script, program or tag inserted into the web page. The key benefit of the browser-based approach is that potentially it is more accurate than server-based approaches for the reasons explained in Table 12.7. This approach usually runs as a hosted solution with the metrics recorded on a remote server. An example of the output reporting from a web analytics service is shown in Figure 12.11 and the data available from a web analytics tool designed for improving the performance of online retailers (and other site types) are shown in Box 12.3.
In addition to the quantitative web analytics measurement approaches discussed, traditional marketing research can be used to help determine the influence of the web-site and related communications on customer perception of the company and its products and services. The options for conducting survey research include interviews, questionnaires, focus groups and mystery shoppers. Each of these techniques can be conducted offline or online. The advantages and disadvantages of the different approaches are shown in Table 12.8.


4.5. AB and multivariate testing
Often site owners and marketers reviewing the effectiveness of a site will disagree and the only method to be certain of the best performing design or creative alternatives is through designing and running experiments to evaluate the best to use. Matt Round, then director of personalization at Amazon, speaking at the E-metrics summit in 2004, said the Amazon philosophy, described further in Case Study 12.1 is
Data trumps intuition.
AB testing and multivariate testing are two measurement techniques that can be used to review design effectiveness to improve results.
AB testing
In its simplest form, A/B or AB testing refers to testing two different versions of a page or a page element such as a heading, image or button. Some members of the site are served alternately with the visitors to the page randomly split between the two pages. Hence it is sometimes called ‘live split testing’. The goal is to increase page or site effectiveness against key performance indicators including clickthrough rate, conversion rates and revenue per visit.
When completing AB testing it is important to identify a realistic baseline or control page (or audience sample) to compare against. This will typically be an existing landing page. Two new alternatives can be compared to previous control, which is known as an ABC test. Different variables are then applied as in Table 12.9.

An example of the power of AB testing is an experiment Skype performed on their main topbar navigation, where they found that changing the main menu options ‘Call Phones’ to ‘Skype Credit’ and ‘Shop’ to ‘Accessories’ gave an increase of 18.75% revenue per visit (Skype were speaking at the 2007 E-metrics summit). That’s significant when you have hundreds of millions of visitors! It also shows the importance of being direct with navigation and simply describing the offer available rather than the activity.
Multivariate testing
Multivariate testing is a more sophisticated form of AB testing which enables simultaneous testing of pages for different combinations of page elements that are being tested. This enables selection of the most effective combination of design elements to achieve the desired goal.
4.6. Clickstream analysis and visitor segmentation
Clickstream analysis refers to detailed analysis of visitor behaviour in order to identify improvements to the site. Each web analytics tool differs slightly in its reports and terminology, but all provide similar reports to help companies assess visitor behaviour and diagnose problems and opportunities. Table 12.10 gives an indication of the type of questions asked by web analyst Dave Chaffey (www.davechaffey.com) when reviewing clients’ sites.

Path analysis
Aggregate clickstreams are usually known within web analytics software as ‘forward’ or ‘reverse’ paths. This is a fairly advanced form of analysis, but the principle is straightforward – you seek to learn from the most popular paths.
Viewed at an aggregate level across the site through ‘top paths’ type reports, this form of clickstream analysis often doesn’t appear that useful. It highlights typically paths which are expected and can’t really be influenced. The top paths are often:
- Home page : Exit
- Home page : Contact Us : Exit
- News page : Exit
Clickstream analysis becomes more actionable when the analyst reviews clickstreams in the context of a single page – this is forward path analysis or reverse path analysis.
On-site search effectiveness
On-site search is another crucial part of clickstream analysis on many sites since it is a key way of finding content, so a detailed search analysis will pay dividends. Key search metrics to consider are:
- Number of searches
- Average number of searches per visitor or searcher
- % of searches returning zero results
- % of site exits from search results
- % of returned searches clicked
- % of returned searches resulting in conversion to sale or other outcome
- Most popular search terms – individual keyword and keyphrases.
Visitor segmentation
Segmentation is a fundamental marketing approach, but is often difficult within web analytics to relate customer segments to web behaviour because the web analytics data aren’t integrated with customer or purchase data, although this is possible in the most advanced systems such as Omniture, Visual Sciences and WebTrends.
However, all analytics systems have a capability for segmentation and it is possible to create specific filters or profiles to help understand one type of site visitor behaviour. Examples include:
- First-time visitors or returning visitors
- Visitors from different referrer types including:
- Google natural
- Google paid
- Strategic search keyphrases, brand keyphrases, etc.
- Display advertising
- Converters against non-converters
- Geographic segmentation by country or region (based on IP addresses)
- Type of content accessed, e.g. are some segment more likely to convert? For example, speaking at Ad Tech London ‘06, MyTravel reported that they segment visitors into:
- Site flirt (2 pages or less)
- Site browse (2 pages or more)
- Saw search results
- Saw quote
- Saw payment details
- Saw booking confirmation details.
5. Budgeting
To estimate profitability and return on investment of e-channels as part of budgeting, companies need to consider both tangible and intangible costs and benefits. A suggested checklist of these is shown in Box 12.4.
A similar approach can be used to calculating the ROI of enhancements to an e-commerce site. Hanson (2000) suggests an approach to this which requires identification of revenue from the site, costs from site and costs from supporting it via a call centre. These are related to profit as follows:
Operating profit = Net income from sales – E-commerce site costs – Call centre costs
Net income from sales = (Product price – Unit cost) X Sales – Fixed product costs
E-commerce site costs = Site fixed costs + ((% site support contacts) X Cost site support contact X Sales)
Call centre (CC) costs = CC fixed costs + ((% CC support contacts) X Cost CC support contact X Sales)
Different approaches for estimating costs are recommended by Bayne (1997):
- Last year’s Internet marketing budget. This is assuming the site has been up and running for some time.
- Percentage of company sales. It is again difficult to establish this for the first iteration of a site.
- Percentage of total marketing budget. This is a common approach. Typically the percentage will start small (less than 5 per cent, or even 1 per cent), but will rise as the impact of the Internet increases.
- Reallocation of marketing dollars. The money for e-marketing will often be taken by cutting back other marketing activities.
- What other companies in your industry are spending. This is definitely necessary in order to assess and meet competitive threats, but it maybe possible that competitors are over-investing.
- Creating an effective online presence. In this model of ‘paying whatever it takes’, a company spends sufficient money to create a web site which is intended to achieve their objectives. This may be a costly option, but for industries in which the Internet is having a significant impact, it may be the wise option. A larger than normal marketing budget will be necessary to achieve this.
- A graduated plan tied into measurable results. This implies an ongoing programme in which investment each year is tied into achieving the results established in a measurement programme.
- A combination of approaches. Since the first budget will be based on many intangibles it is best to use several methods and present high, medium and low expenditure options for executives with expected results related to costs.
In Chapter 1, we started this book with a case study of the world’s largest e-business retailer. We conclude with a case of the world’s second largest e-retailer, showing how the culture of test, learn, refine is key to their success.
Source: Dave Chaffey (2010), E-Business and E-Commerce Management: Strategy, Implementation and Practice, Prentice Hall (4th Edition).
I read this post fully concerning the resemblance of most up-to-date and earlier technologies, it’s
awesome article.