Although we can easily quantify marketing expenses and investments as inputs in the short run, the resulting outputs such as broader brand awareness, enhanced brand image, greater customer loyalty, and improved new product prospects may take months or years to manifest themselves. Meanwhile internal changes within the organization and external changes in the marketing environment may coincide with the marketing expenditures, making it hard to isolate its effects.46
Nevertheless, marketing research must assess the efficiency and effectiveness of marketing activities. Two complementary approaches to measuring marketing productivity are: (1) marketing metrics to assess marketing effects and (2) marketing-mix modeling to estimate causal relationships and measure how marketing activity affects outcomes. Marketing dashboards are a structured way to disseminate the insights gleaned from these two approaches.
1. MARKETING METRICS
Marketers employ a wide variety of measures to assess marketing effects.47 Marketing metrics is the set of measures that helps marketers quantify, compare, and interpret their performance.48 [1]
Marketers choose one or more measures based on the particular issues or problems they face. Mindbody, a web-based business management software provider for the wellness and beauty industries worldwide, tracks numerous online analytics including landing page conversions, click through rates for online ads and rankings on Google search. In addition, MINDBODY monitors the following online metrics on a weekly basis: 1) Website analytics, details on site navigation and online interaction; 2) Social media presence, different demographic and geographic responses to social media channels across different markets; and 3) Permission marketing statistics, measures of interactions and engagement with consumers from auto e-mails. “Marketing Memo: Measuring Social Media ROI” offers some insight into the thorny issue of measuring social media effects.
An advocate of simple, relevant marketing metrics, the University of Virginia’s Paul Farris draws an analogy to the way Boeing 747 jet pilots select information from the vast array of instruments in the cockpit:49
Aircraft pilots have protocols. When they are sitting on the tarmac warming their engines waiting to take off, they are looking at certain things. When they are taxiing, they look at others. When they are in flight, they look at still others. There is a sequence of knowing when to pay attention to which metrics, which lets them have their cake and eat it too, in terms of the simplicity and complexity trade-off.
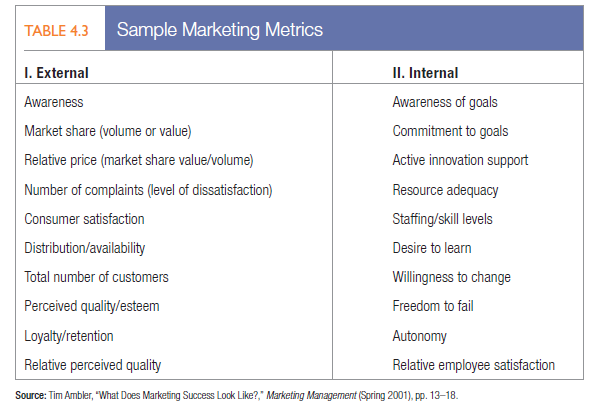
London Business School’s Tim Ambler believes firms can split evaluation of marketing performance into two parts: (1) short-term results and (2) changes in brand equity.50 Short-term results often reflect profit-and- loss concerns as shown by sales turnover, shareholder value, or some combination of the two. Brand-equity measures could include customer awareness, attitudes, and behaviors; market share; relative price premium; number of complaints; distribution and availability; total number of customers; perceived quality, and loyalty and retention.51
Companies can also monitor an extensive set of internal metrics, such as innovation. For example, 3M tracks the proportion of sales resulting from its recent innovations. Ambler also recommends developing employee measures and metrics, arguing that “end users are the ultimate customers, but your own staff are your first; you need to measure the health of the internal market.” Table 4.3 summarizes a list of popular internal and external marketing metrics from Ambler’s survey in the United Kingdom.52
2. MARKETING MEMO Measuring Social Media ROI
Industry expenditures on social media campaigns are expected to double in the next four years, but many marketers do not know what they are getting in return for their dollars. When Audi ran the first Super Bowl ad to feature a Twitter hashtag in 2011, it had no idea how much the high engagement of its Facebook fan base translated into sales of more cars. One report showed that 50 percent of Fortune 1000 companies did not benchmark or measure the payback of their social CRM projects.
Initially, the focus of measuring social media effects was on easily observed quantities like the number of Facebook “likes” and Twitter tweets per week. These did not always correlate with marketing or business success, so researchers began digging deeper. Assessing social media value is not an easy task. Some marketing pundits compare social media to a phone: How would you assess the ROI of all the different calls you make? Josh Bernoff, Forrester Research’s acclaimed digital marketing guru, sees short-term and long-term benefits of social media in four categories:
- Short-term financial benefits, such as increased revenue or decreased costs. On the revenue side, when NetShops.com added ratings and reviews to its site, sales increased 26 percent within six months. On the cost side, National Instruments, makers of sophisticated technical engineering products, found members of its user community answered 46 percent of other users’ questions, saving NI its typical $10 service cost per call. Similarly, AT&T’s revamped online community saved the firm 16 percent in telephone customer support in one month.
- Short-term overall digital benefits. When Swanson Health Products improved the visibility of its product reviews, they became more accessible to search engines, and traffic to its product pages rose 163 percent. Online videos, communities, blogs, and Twitter can similarly boost search performance.
- Long-term brand lift. Social media can improve long-term brand performance measures. When P&G created a Facebook page to support ski jumper Lindsey Van, it solicited 40,000 signatures on a petition to make ski jumping an Olympic sport. Surveys of participating Facebook users found an 8 percent to 11 percent increase in brand preference and purchase intent.
- Long-term risk avoidance. Dealing with a crisis can cost a firm millions of dollars over time. It is better to avoid or avert a crisis before it creates any brand damage. Firms such as McDonald’s and AT&T have customer service teams who monitor Tweets about their products or services to nip any alleged problems in the bud.
Forrester social media analyst Zach Hofer-Shall believes mining actionable insights and measurable feedback from social media requires: (1) the right people to interpret the data, (2) a business purpose to drive strategy, (3) the best social listening platform for achieving goals, and (4) a formalized process for analyzing data and taking action.
The easiest way to create and measure social media’s payoff is to include a contest, sweepstake, or promotion. Silicon Valley ad agency Wildfire created a promotion for Jamba Juice where the value of a “lucky coupon” was revealed only in-store. Tens of thousands of customers entered. The promotion was successful, but social media results can still be unpredictable.
Kumar and his colleagues suggest a seven-step process to social media success with several helpful indices that could be developed for each step:
- Monitor the conversations.
- Identify influential individuals.
- Identify the factors they share.
- Locate potential influencers who have relevant interests.
- Recruit those influencers.
- Incentivize them to spread positive word of mouth.
- Reap the rewards.
Research has also shown that our use of social media differs in significant ways. People tend to be more positive in one-way communications (such as blogs and Twitter) than in two-way forums where they share and discuss brand or product experiences with others.
Sources: “ROI Lacking in Social CRM,” www.warc.com. May 4, 2012; Josh Bernoff, “A Balanced Perspective on Social ROI,” Marketing News, February 28, 2011; Piet Levy, “10 Minutes with . . . Zach Hofer-Shall,” Marketing News, September 15, 2011; Frahad Manjoo, “Does Social Media Have a Return on Investment?,” Fast Company, July/August 2011; David A. Schweidel, Wendy W. Moe, and Chris Boudreaux, “Social Media Intelligence: Measuring Brand Sentiment from Online Conversation,” MSI Report 12-100 (Cambridge, MA: Marketing Science Institute), 2012.
3. MARKETING-MIX MODELING
Marketing accountability also means that marketers must more precisely estimate the effects of different marketing investments. Marketing-mix models analyze data from a variety of sources, such as retailer scanner data, company shipment data, pricing, media, and promotion spending data, to understand more precisely the effects of specific marketing activities.53 To deepen understanding, marketers can conduct multivariate analyses, such as regression analysis, to sort through how each marketing element influences marketing outcomes such as brand sales or market share.
Especially popular with packaged-goods marketers such as Procter & Gamble, Clorox, and Colgate, the findings from marketing-mix modeling help allocate or reallocate expenditures. Analyses explore which part of ad budgets are wasted, what optimal spending levels are, and what minimum investment levels should be.
Although marketing-mix modeling helps to isolate effects, it is less effective at assessing how different marketing elements work in combination. Wharton’s Dave Reibstein also notes three other shortcomings:54
- Marketing-mix modeling focuses on incremental growth instead of baseline sales or long-term effects.
- The integration of important metrics such as customer satisfaction, awareness, and brand equity into marketing-mix modeling is limited.
- Marketing-mix modeling generally fails to incorporate metrics related to competitors, the trade, or the sales force (the average business spends far more on the sales force and trade promotion than on advertising or consumer promotion).
4. MARKETING DASHBOARDS
Firms are also employing organizational processes and systems to make sure they maximize the value of all these different metrics. Management can assemble a summary set of relevant internal and external measures in a marketing dashboard for synthesis and interpretation. Marketing dashboards are like the instrument panel in a car or plane, visually displaying real-time indicators to ensure proper functioning. Formally, marketing dashboards are “a concise set of interconnected performance drivers to be viewed in common throughout the organization.”55
Dashboards are only as good as the information on which they’re based, but sophisticated visualization tools are helping bring data alive. Color-coding, symbols, and different types of charts, tables, and gauges are easy to use and effective. Some companies are also appointing marketing controllers to review budget items and expenses. Increasingly, these controllers use business intelligence software to create digital versions of marketing dashboards that aggregate data from internal and external sources.
As input to the marketing dashboard, companies should include two key market-based scorecards that reflect performance and provide possible early warning signals.
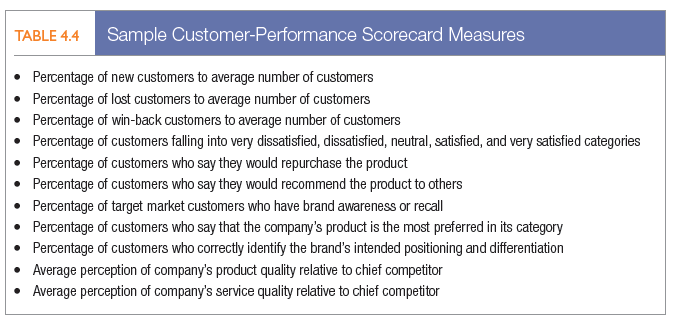
- A customer-performance scorecard records how well the company is doing year after year on such customer-based measures as those shown in Table 4.4. Management should set target goals for each measure and take action when results get out of bounds.
- A stakeholder-performance scorecard tracks the satisfaction of various constituencies who have a critical interest in and impact on the company’s performance: employees, suppliers, banks, distributors, retailers, and stockholders. Again, management should take action when one or more groups register increased or abovenorm levels of dissatisfaction.56
Some executives worry that they’ll miss the big picture if they focus too much on a set of numbers on a dashboard. Some critics are concerned about privacy and the pressure the technique places on employees. But most experts feel the rewards offset the risks. “Marketing Memo: Designing Effective Marketing Dashboards” provides practical advice about the development of these marketing tools.
5. MARKETING MEMO Designing Effective Marketing Dashboards
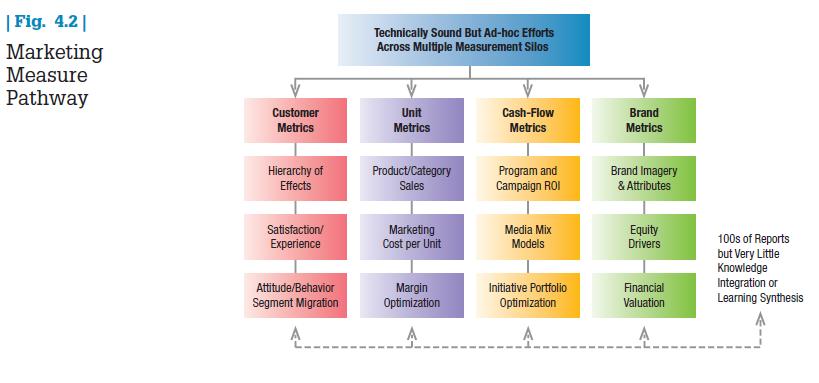
Marketing consultant Pat LaPointe sees marketing dashboards as providing all the up-to-the-minute information necessary to run the business operations for a company—such as sales versus forecast, distribution channel effectiveness, brand equity evolution, and human capital development. According to LaPointe, an effective dashboard will focus thinking, improve internal communications, and reveal where marketing investments are paying off and where they aren’t. LaPointe observes four common measurement “pathways” marketers pursue today (see Figure 4.2).
- The customer metrics pathway looks at how prospects become customers, from awareness to preference to trial to repeat purchase, or some less linear model. This area also examines how the customer experience contributes to the perception of value and competitive advantage.
- The unit metrics pathway reflects what marketers know about sales of product/service units—how much is sold by product line and/or by geography; the marketing cost per unit sold as an efficiency yardstick; and where and how margin is optimized in terms of characteristics of the product line or distribution channel.
- The cash-flow metrics pathway focuses on how well marketing expenditures are achieving short-term returns. Program and campaign ROI models measure the immediate impact or net present value of profits expected from a given investment.
- The brand metrics pathway tracks the development of the longer-term impact of marketing through brand equity measures that assess both the perceptual health of the brand from customer and prospective customer perspectives and the overall financial health of the brand.
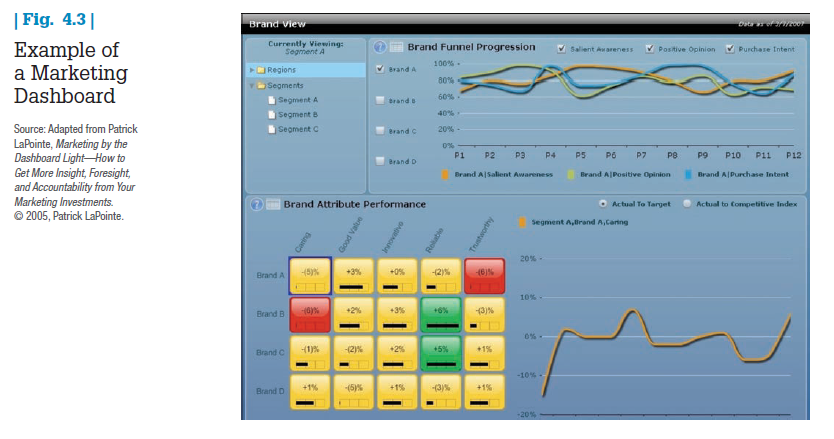
LaPointe feels a marketing dashboard can present insights from all the pathways in a graphically related view that helps management see subtle links between them. Tabs can allow the user to toggle easily between different “families” of metrics organized by customer, product, experience, brand, channels, efficiency, organizational development, or macroenvironmental factors. Each tab presents the three or four most insightful metrics, with data filtered by business unit, geography, or customer segment based on the users’ needs. (See Figure 4.3 for a sample brand metrics page.)
Ideally, over time the number of metrics on the dashboard will be reduced to a few key drivers. Meanwhile, the process of developing and refining the marketing dashboard will undoubtedly raise and resolve many key questions about the business.
Source: Adapted from Pat LaPointe, Marketing by the Dashboard Light, Association of National Advertisers, 2005, www.MarketingNPV.com.
Source: Kotler Philip T., Keller Kevin Lane (2015), Marketing Management, Pearson; 15th Edition.
Generally I don’t read article on blogs, however I wish to say that this write-up very pressured me to take a look at and do it! Your writing style has been amazed me. Thanks, very great post.