In this problem, we will examine the missing data to see if they appear to be MAR and to see if multiple imputation seems advisable.
13.1. What are the patterns of missing values of weight, binge, mood, and preo? Is multiple imputation advisable for any of these variables? If so, which ones?
- Click on Analyze → Multiple Imputation → Analyze Patterns. You should get a dialog box like 13.1. Note that Missing Values Analysis is listed on the menu above Multiple Imputation but you click on the latter.
- Select weight 1 through weight 4 and move them over to analyze across variables. Do the same with binge 1-4, mood 1-4, and preo1-4. Make sure that Summary of missing values, Patterns of missing values, and Variables with the highest frequency of missing values are all checked. Change the Minimum percentage missing from 10 to 1. See 13.1.
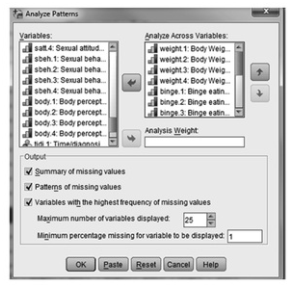
Fig. 13.1. Analyze patterns.
- Click on “OK”. Your output should look like Output 13.1.
Output 13.1: Analyze Patterns
GET
FILE=’X:\Morgan Documents\SPSS 5th Ed. Intermediate\Data Sets\anorectic3.sav’.
DATASET NAME DataSet1 WINDOW=FRONT.
*Analyze Patterns of Missing Values.
MULTIPLE IMPUTATION weight.1 weight.2 weight.3 weight.4 binge.1 binge.2 binge.3 binge.4 mood.1 mood.2 mood.3 mood.4 preo.1 preo.2 preo.3 preo.4
/IMPUTE METHOD=NONE
/MISSINGSUMMARIES OVERALL VARIABLES (MAXVARS=25
MINPCTMISSING=1) PATTERNS.
Multiple Imputation
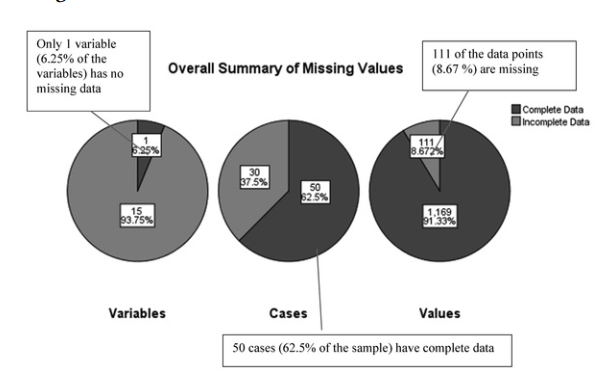
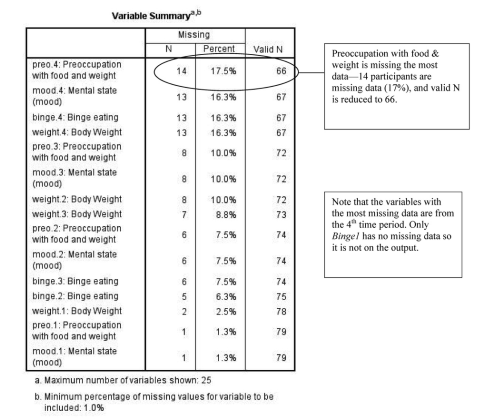
Interpretation of Output 13.1 (continued) The Variable Summary table specifies the number of missing cases, percent missing, and valid N for each variable that is missing at least 1% of the data. We can see that from 1-14 participants (1-17.5% of the sample) are missing data on these variables. Given the sample size, this is sufficient missing data to warrant imputation, as it would decrease power and accuracy of results with these variables, especially with those variables with 10% or more missing.
Each row shows a particular pattern of missing data. Row 1 shows the pattern of no missing data. All other rows involve some missing data.
Variable
Each variable is listed at the bottom, with a hatch mark indicating the middle of the column referring to that variable.
Interpretation of Output 13.1 (continued) The Missing Value Patterns figure is the most important one. It shows 16 different patterns of missing values that exist in the data, in terms of which data are missing. The pattern types are numbered on the left side. So, for example, pattern 2 involves missing only the variable weight 2; pattern 16 involves missing binge 3, weight 3, mood 3, preo 3, weight 4, binge 4, mood 4, and preo 4. So, pattern 16 seems systematic, but not related specifically to one particular variable; rather, it seems to include participants who stopped participating after the second timepoint.
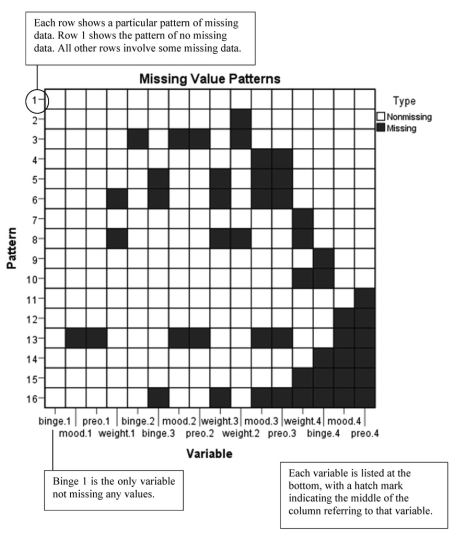

Interpretation of Output 13.1 (continued) This bar chart shows that the most common pattern by far is pattern 1 (no missing data). However, pattern 15, in which time 4 data are missing, is second most common. This suggests that we may want to use
time of assessment as a predictor variable.
Example of How to Write About Output 13.1
(note that usually results of outputs 13.1 and 13.2 would be included in the same section).
Method
In order to see the patterns of missing data shown in the variables to be used in the study and to better determine whether it was reasonable to consider data missing at random (MAR), missing values analysis was conducted. Results suggested that there were 16 different patterns of missing data. The most common pattern was one with no missing data, but several other patterns were found for particular sets of participants. Seven variables had missing data for at least 10% of the sample, and one pattern, in which time 4 data were all missing, was shown by about 10% of the sample. These results suggested that multiple imputation would be desirable and that time of measurement should be included as a predictor of missingness.
Source: Leech Nancy L. (2014), IBM SPSS for Intermediate Statistics, Routledge; 5th edition;
download Datasets and Materials.
I’ve been absent for some time, but now I remember why I used to love this web site. Thanks , I¦ll try and check back more frequently. How frequently you update your web site?