Research hypotheses are predictive statements about the relationship between variables. Research questions are similar to hypotheses, except that they do not entail specific predictions and are phrased in question format. For example, one might have the following research question: “Is there a difference in students’ scores on a standardized test if they took two tests in one day versus taking only one test on each of two days?” A hypothesis regarding the same issue might be: “Students who take only one test per day will score higher on standardized tests than will students who take two tests in one day.”
We divide research questions into three broad types: difference, associational, and descriptive, as shown in the middle of Fig. 1.1. The figure also shows the general and specific purposes and the general types of statistics for each of these three types of research question. We think it is educationally useful to divide inferential statistics into two types corresponding to difference and associational hypotheses or questions.[1] Difference inferential statistics (e.g., t test or analysis of variance) are used for approaches that test for differences between groups. Associational inferential statistics test for associations or relationships between variables and use, for example, correlation or multiple regression analysis. We utilize this contrast between difference and associational inferential statistics in Chapter 6 and later in this book.
Difference research questions. For these questions, we compare scores (on the dependent variable) of two or more different groups, each of which is composed of individuals with one of the values or levels on the independent variable. This type of question attempts to demonstrate that the groups are not the same on the dependent variable.
Associational research questions. Here we associate or relate two or more variables. This approach usually involves an attempt to see how two or more variables covary (e.g., if a person has higher values on one variable, he or she is also likely to have higher, or lower, values on another variable) or how one or more variables enable one to predict another variable.
Descriptive research questions. These are not answered with inferential statistics. They merely describe or summarize data for the sample actually studied, without trying to generalize to a larger population of individuals.
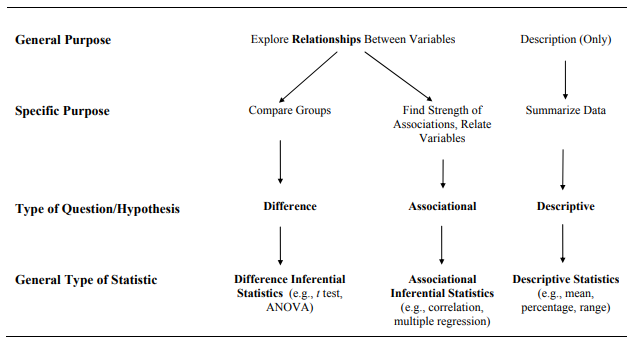
Fig. 1.1. Schematic diagram showing how the purpose and type of research question correspond to the general type of statistic used in a study.
Fig. 1.1 shows that both difference and associational questions or hypotheses explore the relationships between variables; however, they are conceptualized differently, as will be described shortly.[2] Note that difference and associational questions differ in specific purpose and the kinds of statistics they use to answer the question.
Table 1.1 provides the general format and one example of a basic difference question, a basic associational question, and a basic descriptive question. Remember that research questions are similar to hypotheses, but they are stated in question format. We think it is advisable to use the question format for the descriptive approach or when one does not have a clear directional prediction. More details and examples are given in Appendix B. As implied by Fig. 1.1, it is acceptable to phrase any research question that involves two variables as whether or not there is a relationship between the variables (e.g., is there a relationship between gender and math achievement or is there a relationship between anxiety and GPA?). However, we think that phrasing the question as a difference or association is preferable because it helps one identify an appropriate statistic and interpret the result.
Complex Research Questions
Some research questions involve more than two variables at a time. We call such questions and the appropriate statistics complex. Some of these statistics are called multivariate in other texts, but there is not a consistent definition of multivariate in the literature. We provide examples of how to write certain complex research questions in Appendix B, and in Chapters 8 and 10, we introduce two complex statistics: multiple regression and factorial ANOVA. Complex statistics are discussed in more detail in our companion volume, Leech et al. (in press).
Table 1.1. Examples of Three Kinds of Basic Research Questions/Hypotheses
- Basic Difference (group comparison) Questions
- Usually used for randomized experimental, quasi-experimental, and comparative approaches.
- For this type of question, the groups of individuals who share a level of an active independent variable (e.g., intervention group) or an attribute independent variable (e.g., male gender) are compared to individuals who share the other levels of that same independent variable (e.g., control group or female gender) to see if the groups differ with regard to the average scores on the dependent variable (e.g., aggression scores).
- Example: Do persons who experienced an emotion regulation intervention differ from those who did not experience that intervention with respect to their average aggression scores? In other words, will the average aggression score of the intervention group be significantly different from the average aggression score for the control group following the intervention?
- Basic Associational (relational) Questions
- Used for the associational approach, in which the independent variable usually is continuous (i.e., has many ordered levels).
- For this type of question, the scores on the independent variable (e.g., anxiety) are associated with or related to the dependent variable scores (e.g., GPA).
- Example: Will students’ degree of anxiety be associated with their overall GPA? In other words, will knowing students’ level of anxiety tell us anything about their tendency to make higher versus lower grades? If there is a negative association (correlation) between anxiety scores and grade point average, those persons who have high levels of anxiety will tend to have low GPAs, those with low anxiety will tend to have high GPAs, and those in the middle on anxiety will tend to be in the middle on GPA.
- Basic Descriptive Questions
- Used for the descriptive approach.
- For this type of question, scores on a single variable are described in terms of their central tendency, variability, or percentages in each category/level.
- Example: What percentage of students make a B or above? What is the average level of anxiety found in 9th grade students? The average GPA was 2.73, or 30% had high anxiety.
[1] We realize that all parametric inferential statistics are relational so this dichotomy of using one type of data analysis procedure to test for differences (when there are a few values or levels of the independent variables) and another type of data analysis procedure to test for associations (when there are continuous independent variables) is somewhat artificial. Both continuous and categorical independent variables can be used in a general linear model approach to data analysis. However, we think that the distinction is useful because most researchers utilize the dichotomy in selecting statistics for data analysis.
[2]This similarity is in agreement with the statement by statisticians that all common parametric inferential statistics are relational. We use the term associational for the second type of research question rather than relational or correlational to distinguish it from the general purpose of both difference and associational questions/hypotheses, which is to study relationships. Also we want to distinguish between correlation, as a specific statistical technique, and the broader type of associational question and that group of statistics.
Source: Morgan George A, Leech Nancy L., Gloeckner Gene W., Barrett Karen C.
(2012), IBM SPSS for Introductory Statistics: Use and Interpretation, Routledge; 5th edition; download Datasets and Materials.
16 Sep 2022
27 Mar 2023
14 Sep 2022
20 Sep 2022
19 Sep 2022
28 Mar 2023