Next, we will conduct the actual imputations, but first, we need to restructure the dataset so that we can use the information about time to predict missingness (given what we found before about patterns 15 and 16 in which some participants stopped participating after time 2 or 3.
- Click on Date→Restructure.
- In the Restructure Data Wizard, select Restructure selected variables into cases (the default). Click on Next to produce 13.2.
- Select More than one and type in 4 instead of 2. See 13.2.
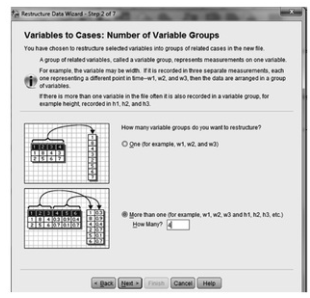
Fig.13.2.Number of variable groups.
- Select Use case number and keep the default (id). (See 13.3.) In this case, you will not actually need the id, as you have another case number (patient number) that you will keep, but we wanted to show you what happens when you do ask for an id number.
- For target variable, delete transl and type in “weight.”
- Select the weight variables (weightl–weight4) and move them to the box below Target Variable.
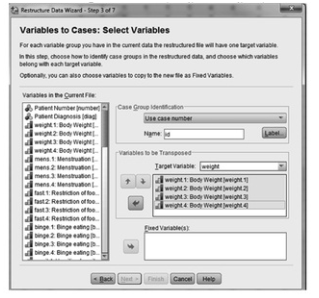
Fig.13.3.Select variables.
- Use the drop-down menu by the side of target variable to select the next variable, trans2. This time, delete trans2 and type in binge.
- Select the 4 binge variables and move them over.
- Repeat these same steps for trans3, typing in “mood” and moving those 4 over. Repeat for trans4 and “preo.”
- Move patient number to the “Fixed variable” box. Click on Next.
- Select one Click on Next.
- Select Sequential numbers and change the name from indexl to time. Click on Next.
- On the next screen, in the System Missing or Blank Values in all Transposed Variables box, leave it as the default (create a case in the new file). Click on Next.
- You will then be brought to the Finish screen and asked “What would you like to do?” Select Restructure the Data Now Then click Finish.
- You will see a new version of the dataset on your screen, which will be restructured so that each case has 4 lines (one for each assessment time) and there are just 7 variables: id, number, time, weight, binge, mood, and preo. For each case, the first line is the first assessment, the second line is the second assessment, and so on.
- Click on File^Save as. You will get a box in which the File name is listed as anorectic3.sav. Change that file name to anorectic4 and save it where you saved your other datasets.
Now, you are ready to impute missing values.
- Click on Analyze → Multiple Imputation →Impute Missing Data Values
- You should get a window box like 13.4. Select all variables except id and number and move them over to Variables in Model.

Fig.13.4.Impute missing data values.
- Click on the drop-down menu next to imputations, and increase the number to 20. (Research shows that 20 imputations should provide good estimates of the missing values.) Click on Create a new dataset and type imputeanorectic4 in the box. You should see a screen like Fig. 13.5.
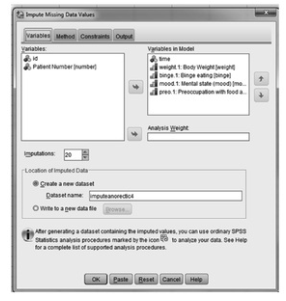
Fig.13.5.Impute missing data values.
- Click on the tab for Method (top left) and click on Custom: Fully conditional specification (since we know that we do not have a monotone distribution of missing values). Under Maximum iterations, increase the number to 20, just in case more iterations are needed to converge on the missing values. Leave the other menu values that are there. They are the defaults.
- Click on the tab for Constraints. For time, use the drop-down menu to indicate that you want to use it as a predictor only. All others should remain as they are (impute and use as predictor). Click on Exclude variables with large amounts of missing data, and specify that you want no more than 50% missing. From problem 13.1, we know that this will not be needed, but it is a good practice in general.
- Click on the tab for Output and click on Descriptive statistics. Leave imputation model checked as well. Click on OK. We have omitted some parts of the output, to conserve space, but we will highlight important parts in Output 13.2.
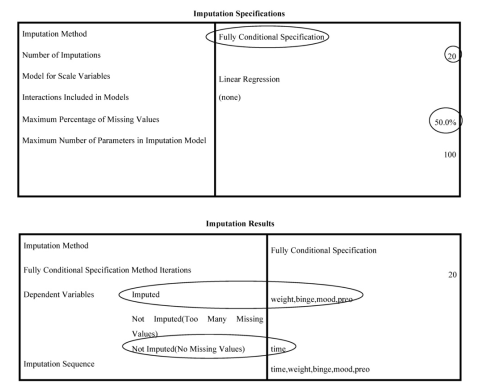
Output 13.2: Impute Data

Interpretation of Output 13.2
The Imputation tables allow us to check that things were run as specified. The first table shows the Imputation Method is Fully Conditional Specification, there are 20 Imputations; and there is a Maximum of 50% missing values.
The second table shows that weight, binge, mood, and preo are the imputed dependent variables, and time is not imputed.
In the imputation of missing values for body •weight, logistic regression was used, with time, binge, mood, andpreo as the predictors.
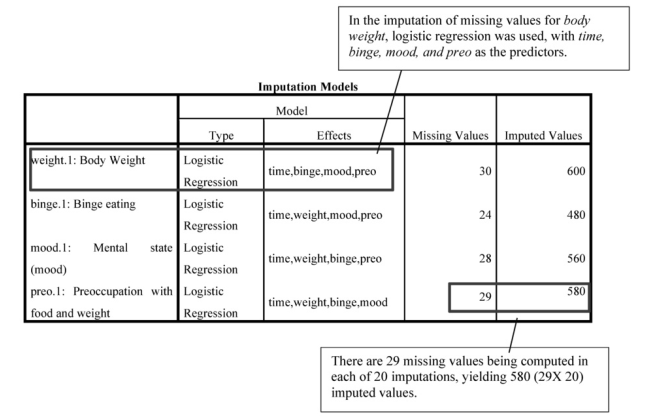
There are 29 missing values being computed in each of 20 imputations, yielding 580 (29X 20) imputed values.
Interpretation of Output 13.2 continued This Imputation Model table indicates that, in conducting the imputation, logistic regression was used to predict Weight from all other variables, binge from all other variables, mood from all other variables, and Preo from all other variables. It also indicates the number of Missing Values and Imputed Values (which is the requested 20 imputations X # of missing values=580). Note that because imputations are generated based on a random procedure, your values in this table will not be exactly like ours. There is a way to “set the random seed” to generate the same imputations again, but it is beyond the scope of this chapter.
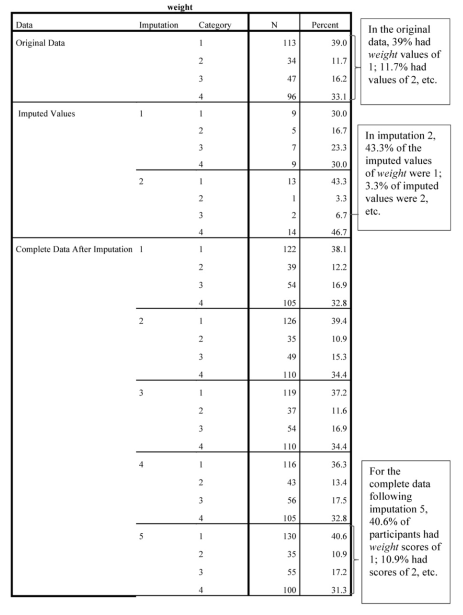
The weight table that follows (which we have truncated to save space) indicates the percentage of people with each value of weight for the Original Data, the Imputed Values (here only the first 2 imputations are shown), and the Complete Data after each imputation (shown for 5 imputations).
How to Write About Problem 13.2
(usually results of this and Output 13.1 would be included in the same section).
Method
Multiple imputation was used to replace missing data. Multiple imputation creates multiple copies of the original data set, with the missing data being replaced in each copy with plausible sets of values. Each imputed data set is then analyzed separately, and parameters for the analyses are averaged across imputations. Multiple imputation, thus, is aimed at creating estimates that are not biased by missing data. Logistic regressions were used to impute missing data, with time and each of the variables other than the one being imputed being used as predictors. Twenty imputations were run in order to better converge on strong approximations of the missing data. Results of the imputation were saved as a dataset to be used in the primary analysis examining the relation of binging, mood, and preoccupation with one’s body to changes in weight over time in eating disordered individuals.
Source: Leech Nancy L. (2014), IBM SPSS for Intermediate Statistics, Routledge; 5th edition;
download Datasets and Materials.
I like this web blog so much, saved to fav.