Now that we are acquainted with the numbers in Table 17.5, we may try to answer the questions we posed before and related ones. A standard normal curve implies normal distribution. This means the data we have on hand should conform, in terms of frequency distribution, reasonably closely to normal distribution. If the population is very large or infinite, a sample of suitable size is collected using an appropriate method (or combination of methods), as described in Chapter 16. Elements in the sample set, in such a case, should conform reasonably to normal distribution. To be able to read the probability values in terms of APSND as a way of answering questions, we need to have the numerical values of just two statistics: the mean (μ) and the standard deviation (σ) of the random variable. Computation of these is fairly easy, as even hand-held calculators are capable of this. Once the computation is done, it is not necessary to have aplot of the data for a nswering the various questions. Here lies the “ready reference” nature of the standard normal curve, with the associated APSND table.
For purposes of illustration, we assume that the data we have on hand are of original population and, further, that the mean and the standard deviation of the random variables are known.
Example 1:
(Question 1 stated in Section 17.6)
Data:
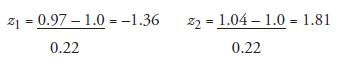
Mean (nominal length): 1.0 in.
Standard deviation, assumed to be known:0.22 X1 = 0.97 X2 = 1.04
-

- For Z1 = -1.36, read from table, APSND: 0.4131 For Z2 = 1.81, read from table, APSND: 0.4649
- Area corresponding to the question: total area on both sides of z = 0, that is, (0.4131 + 0.4649) = 0.8780
Answer: The required probability is 87.8 percent.
Example 2:
(Question 2 stated in Section 17.6)
The length of full-term newborn babies in United States is a matter of national statistics, but we will assume the following data:
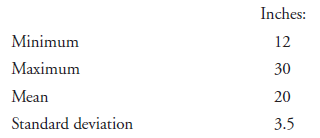
Following are the steps for the answer:
-
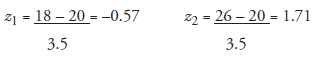
- For z1 = -0.57, APSND: 0.2157 For z2 = 1.71, APSND: 0.4564
- Interpreting the above numbers, the area corresponding to the question: the total area on both sides of z = 0, that is, (0.2157 + 0.4564) = 0.672 (approx.)
- Answer: The required probability is 67.2 percent.
We may close this chapter with a reminder that to be able to use this powerful tool, the standard normal probability function, we do not need to have a plotted normal distribution curve. To be able to answer the relevant questions, we only need to know the range of the variable and the corresponding numerical values of ft and O. However, unless these values have been derived from a population of a reasonably large number of elements or from a reasonably large sample when the population is very large, we cannot develop confidence in the answers. Besides, it is imperative in the function y = f(x) that the values ofy are such that the lines connecting these offer a reasonable approximation to normal distribution. This needs to be confirmed. Any and every y = fx) relation will not necessarily offer a tendency to normal distribution (see Chapter 15).
Source: Srinagesh K (2005), The Principles of Experimental Research, Butterworth-Heinemann; 1st edition.
4 Aug 2021
5 Aug 2021
5 Aug 2021
5 Aug 2021
4 Aug 2021
5 Aug 2021