Uncertainty means that more things can happen than will happen. Therefore, whenever managers are given a cash-flow forecast, they try to determine what else may happen and the implications of these possible surprise events. This is called sensitivity analysis.
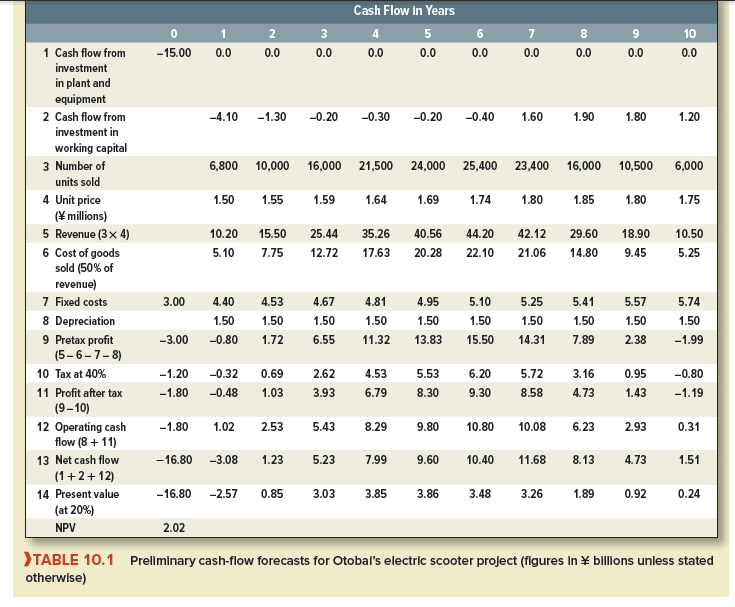
Put yourself in the well-heeled shoes of the financial manager of the Otobai Company in Osaka. You are considering the introduction of a high-performance electric scooter for city use. Your staff members have prepared the cash-flow forecasts shown in Table 10.1. Since NPV is positive at the 20% opportunity cost of capital, it appears to be worth going ahead, but before you decide, you want to delve into these forecasts and identify the key variables that determine whether the project succeeds or fails.
The project requires an initial investment of ¥15 billion in plant and machinery, which will have negligible further value when the project comes to an end. As sales build up in the early and middle years of the project, the company will need to make increasing investments in net working capital, which is recovered in later years. After year 6, the company expects sales to tail off as other companies enter the market, and the company will probably need to reduce the price of the scooter. The cost of goods sold is forecast to be 50% of sales; in addition, there will be fixed costs each year that are unrelated to the level of sales. Taxes at a 40% rate are computed after deducting straight-line depreciation.
These seem to be the important things you need to know, but look out for unidentified variables that could affect these estimates. Perhaps there could be patent problems, or perhaps you will need to invest in service stations that will recharge the scooter batteries. The greatest dangers often lie in these unknown unknowns, or “unk-unks,” as scientists call them.
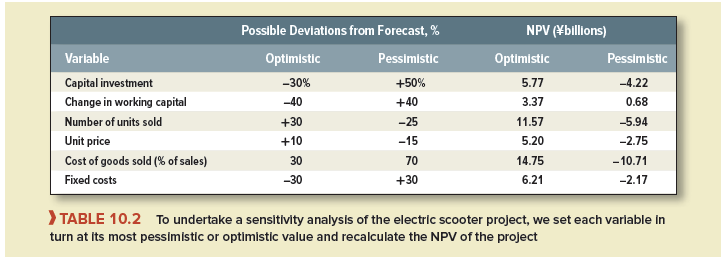
Having found no unk-unks (no doubt you will find them later), you conduct a sensitivity analysis with respect to the required investment in plant and working capital and the forecast unit sales, price, and costs. To do this, the marketing and production staffs are asked to give optimistic and pessimistic estimates for each of the underlying variables. These are set out in the second and third columns of Table 10.2. For example, it is possible that sales of scooters could be 25% below forecast, or you may be obliged to cut the price by 15%. The fourth and fifth columns of the table shows what happens to the project’s net present value if the variables are set one at a time to their optimistic and pessimistic values. Your project appears to be by no means a sure thing. The most dangerous variables are cost of goods sold and unit sales. If the cost of goods sold is 70% of sales (and all other variables are as expected), then the project has an NPV of – ¥10.7 billion. If unit sales each year turn out to be 25% less than you forecast (and all other variables are as expected), then the project has an NPV of – ¥5.9 billion.
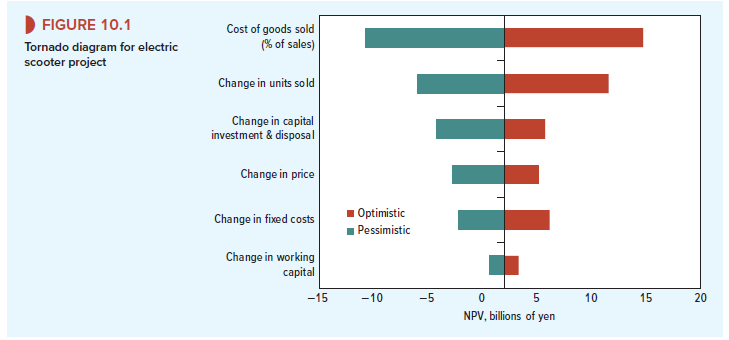
Trendy consultants sometimes use a tornado diagram such as Figure 10.1 to illustrate the results of a sensitivity analysis. The bars at the summit of the tornado show the range of NPV outcome due to uncertainty about the level of sales. At the base of the tornado you can see the more modest effect of uncertainty about investment in working capital and the level of fixed costs.1
1. Value of Information
The world is uncertain, and accurate cash-flow forecasts are unattainable. So, if a project has a positive NPV based on your best forecasts, shouldn’t you go ahead with it regardless of the fact that there may be later disappointments? Why spend time and effort focusing on the things that could go wrong?
Sensitivity analysis is not a substitute for the NPV rule, but if you know the danger points, you may be able to modify the project or resolve some of the uncertainty before your company undertakes the investment. For example, suppose that the pessimistic value for the cost of goods sold partly reflects the production department’s worry that a particular machine will not work as designed and that the operation will need to be performed by other methods. The chance of this happening is only 1 in 10. But, if it does occur, the extra cost would reduce the NPV of your project by ¥2.5 billion, putting the NPV underwater at +2.02 – 2.50 = – ¥0.48 billion. Suppose that a ¥100 million pretest of the machine would resolve the uncertainty and allow you to clear up the problem. It clearly pays to invest ¥100 million to avoid a 10% probability of a ¥2.5 billion fall in NPV. You are ahead by -0.1 + .10 X 2.5 = ¥0.15 billion. On the other hand, the value of additional information about working capital is small. Because the project is only marginally unprofitable, even under pessimistic assumptions about working capital, you are unlikely to be in trouble if you have misestimated that variable.
2. Limits to Sensitivity Analysis
Sensitivity analysis boils down to expressing cash flows in terms of key project variables and then calculating the consequences of misestimating those variables. It forces the manager to identify the crucial determinants of the project’s success and indicates where additional information would be most useful or where design changes may be needed.
One drawback to sensitivity analysis is that it always gives somewhat ambiguous results. For example, what exactly does optimistic or pessimistic mean? The marketing department may be interpreting the terms in a different way from the production department. Ten years from now, after hundreds of projects, hindsight may show that the marketing department’s pessimistic limit was exceeded twice as often as that of the production department, but what you may discover 10 years hence is no help now. Of course, you could specify that when you use the terms “pessimistic” and “optimistic,” you mean that there is only a 10% chance that the actual value will prove to be worse than the pessimistic figure or better than the optimistic one. However, it is far from easy to extract a forecaster’s notion of the true probabilities of possible outcomes.
Another problem with sensitivity analysis is that the underlying variables are likely to be interrelated. For example, if inflation pushes prices to the upper end of your range, it is quite probable that costs will also be inflated. And if sales are unexpectedly high, you may need to invest more in working capital. Sometimes the analyst can get around these problems by
defining underlying variables so that they are roughly independent. For example, it made more sense for Otobai to look at cost of goods sold as a proportion of sales rather than as a dollar value. But you cannot push one-at-a-time sensitivity analysis too far. It is impossible to obtain expected, optimistic, and pessimistic values for total project cash flows from the information in Table 10.2.
Sensitivity analysis boils down to expressing cash flows in terms of key project variables and then calculating the consequences of misestimating the variables. It forces the manager to identify the underlying variables, indicates where additional information would be most useful, and helps to expose inappropriate forecasts.
3. Scenario Analysis
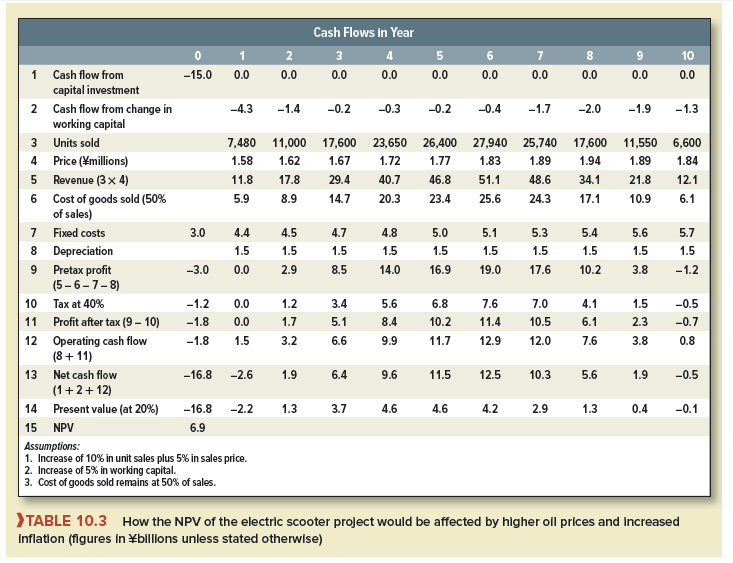
If the variables are interrelated, it may help to consider some alternative plausible scenarios. For example, perhaps the company economist is worried about the possibility of a sharp rise in world oil prices. The direct effect of this would be to encourage the use of electrically powered transportation. The popularity of hybrid cars after a recent oil price increases leads you to estimate that an immediate 20% rise in the price of oil would enable you to increase unit sales by 10% a year. On the other hand, the economist also believes that higher oil prices would stimulate inflation, which would affect selling prices, costs, and working capital. Table 10.3 shows that this scenario of higher oil prices and higher inflation would on balance help your new venture. Its NPV would increase to ¥6.9 billion.
Managers often find such scenario analysis helpful. It allows them to look at different, but consistent, combinations of variables. Forecasters generally prefer to give an estimate of revenues or costs under a particular scenario than to give some absolute optimistic or pessimistic value.
Have you ever thought about publishing an ebook or guest authoring on other websites?
I have a blog centered on the same ideas you discuss and would love to have you share some stories/information. I know my readers would appreciate your work.
If you’re even remotely interested, feel free to send me an e-mail.
Good post but I was wondering if you could
write a litte more on this subject? I’d be very thankful if you could elaborate a little bit
more. Thank you!
These are in fact fantastic ideas in about blogging.
You have touched some nice factors here. Any way keep up wrinting.
I am truly grateful to the holder of this web page who has shared this enormous article at at this time.
You must take part in a contest for the most effective blogs on the web. I’ll advocate this web site!