1. Break-Even Analysis
When we undertake a sensitivity analysis of a project or when we look at alternative scenarios, we are asking how serious it would be if sales or costs turn out to be worse than we forecasted. Managers sometimes prefer to rephrase this question and ask how bad things can get before the project NPV turns negative. This exercise is known as break-even analysis.
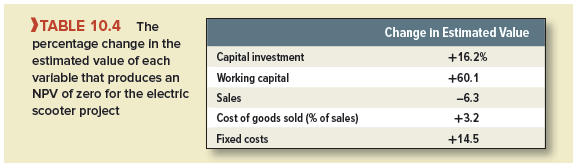
We saw earlier that the profitability of Otobai’s project could be severely damaged if unit sales are unexpectedly low. Therefore, management might look at how far unit sales could fall before the project becomes a loser. A 1% annual shortfall in unit sales would turn NPV from ¥2.02 to -¥1.70, a decline of ¥0.32. So NPV would be exactly zero if each year sales fell by 1% x (2.02)/(0.32) = 6.3% below forecast.
Table 10.4 shows the break-even points for each of the other variables. You can see, for example, that quite small errors in your forecasts for unit sales, price, and variable costs could cause your project to become a loser. On the other hand, the project would still break even (NPV = 0) if you have underestimated working capital by 60.1%.
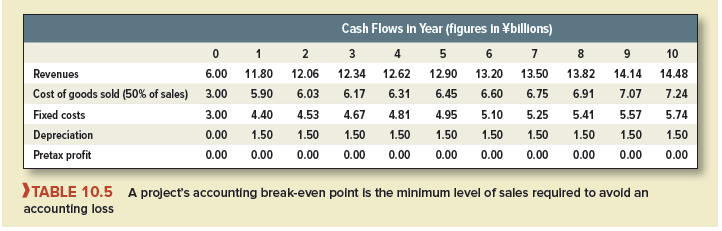
Table 10.4 defines break-even as the point at which NPV would be exactly zero. But managers frequently calculate break-even points in terms of accounting profits rather than net present values. For example, look at Table 10.5, which shows the minimum level of sales that Otobai needs each year to avoid a loss on its scooter project. You can see that in year 1, Otobai needs sales of ¥11.80 billion to cover costs and depreciation. In year 2, the break-even sales level rises to ¥12.06 billion.[1]
Should Otobai’s manager be relaxed if the project breaks even each year in accounting terms? It is true that its revenues will then be sufficient to cover the operating costs and repay the initial investment. But they will not be sufficient to repay the opportunity cost of capital on that ¥15 billion. A project that breaks even in accounting terms will surely have a negative NPV.
2. Operating Leverage and the Break-Even Point
A project’s break-even point depends on the extent to which its costs vary with the level of sales. Suppose that electric scooters fall out of favor. The bad news is that Otobai’s sales revenue is less than you had hoped, but you have the consolation that the cost of goods sold is also lower. But, any costs that are fixed do not decline along with sales, and, therefore, any shortfall in sales has a greater impact on profitability. Of course, a high proportion of fixed costs is not all bad. The firm whose costs are fixed fares poorly when demand is low but makes a killing during a boom.
A business with high fixed costs is said to have high operating leverage. Operating leverage is usually defined in terms of accounting profits rather than cash flows and is measured by the percentage change in profits for each 1% change in sales. Thus the degree of operating leverage (DOL) is
![]()
The following simple formula shows how DOL is related to the business’s fixed costs (including depreciation) as a proportion of pretax profits:
![]()
For example, in year 2 of the scooter project,
![]()
A 1% increase in the project’s year-2 revenues would result in a 4.5% rise in profits.
I’m still learning from you, but I’m improving myself. I absolutely liked reading everything that is written on your site.Keep the posts coming. I enjoyed it!
But wanna remark on few general things, The website style is perfect, the articles is very superb : D.