Based in Boston and having 6,200 consultants worldwide, the Boston Consulting Group (BCG) has 87 offices in 45 countries, and annually ranks in the top five of Fortune’s list of the “100 Best Companies to Work For.” The Boston Consulting Group is a private management consulting firm that specializes in strategic planning.
Autonomous divisions (also called segments or profit centers) of an organization make up what is called a business portfolio. When a firm’s divisions compete in different industries, a separate strategy often must be developed for each business. The Boston Consulting Group (BCG) Matrix and the Internal-External (IE) Matrix are designed specifically to enhance a multidivisional firm’s efforts to formulate strategies. Allocating resources across divisions is arguably the most important strategic decision facing multidivisional firms. Multidivisional firms range in size from small, three-restaurant, mom-and-pop firms, to huge conglomerates such as Walt Disney Company, to universities that have various schools or colleges—and they all need to use portfolio analysis.
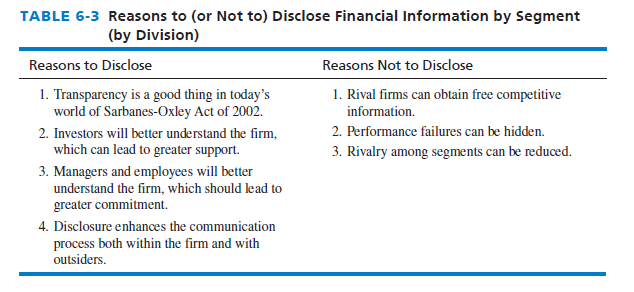
In a Form 10K or Annual Report, some companies do not disclose financial information by segment, in which case a BCG portfolio analysis may not be possible by persons external to the firm. However, reasons to disclose by segment financial information in a Form 10K more than offset the reasons not to disclose, as indicated in Table 6-3.
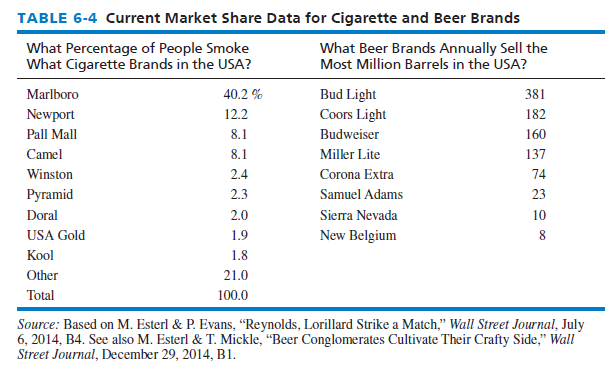
The BCG Matrix graphically portrays differences among divisions based on two dimensions: (1) relative market share position on the x-axis and (2) industry growth rate on the y-axis. The BCG Matrix allows a multidivisional organization to manage its portfolio of businesses by examining these two dimensions for each division relative to other divisions in the organization. Relative market share position (RMSP) is defined as the ratio of a division’s own market share (or revenues) in a particular industry to the market share (or revenues) held by the largest rival firm in that industry. Other variables can be used in this analysis besides revenues. For example, number of stores, or number of restaurants, or, in the airline industry, number of airplanes could be used for comparative purposes to determine relative market share position. In the cigarette industry, for example, Newport’s relative market share position is 12.2/40.2 = 0.303, and Miller Lite’s relative market share position is 137/381 = 0.359 (see Table 6-4).
Relative market share position is given on the x-axis of the BCG Matrix. The midpoint on the x-axis usually is set at 0.50, corresponding to a division that has half the market share of the leading firm in the industry. The y-axis represents the industry growth rate (IGR) in sales, measured in percentage terms—that is, the average annual increase in revenue for all firms in an industry. The growth rate percentages on the y-axis could range from -20 to +20 percent, with 0.0 being the midpoint. The average annual increase in revenues for several leading firms in the industry would be a good estimate of the value. Also, various sources such as the S&P Industry Surveys and www.finance.yahoo.com (click on Competitors) would provide this value. These numerical ranges on the x- and y-axes are often used, but other numerical values could be established as deemed appropriate for particular organizations, such as -10 to +10 percent on the y-axis.
Based on each division’s respective (x, y) coordinate, each segment can be properly positioned (centered) in a BCG Matrix. Divisions located in Quadrant I (upper right) of the BCG Matrix are called “Question Marks,” those located in Quadrant II (upper left) are called “Stars,” those located in Quadrant III (lower left) are called “Cash Cows,” and those divisions located in Quadrant IV (lower right) are called “Dogs.” The following list describes the four BCG quadrants.
- Question Marks—Divisions in Quadrant I (upper right) have a low relative market share position, yet they compete in a high-growth industry. Generally these firms’ cash needs are high and their cash generation is low. These businesses are called question marks because the organization must decide whether to strengthen them by pursuing an intensive strategy (market penetration, market development, or product development) or to sell them.
- Stars—Divisions in Quadrant II (upper left) represent the organizations’ best long-run opportunities for growth and profitability, and are therefore called stars. Divisions with a high relative market share and a high industry growth rate should receive substantial investment to maintain or strengthen their dominant positions. Forward, backward, and horizontal integration; market penetration; market development; and product development are appropriate strategies for these divisions to consider, as indicated in Figure 6-7.
- Cash Cows—Divisions in Quadrant III (lower left) have a high relative market share position but compete in a low-growth industry. Called cash cows because they generate cash in excess of their needs, they are often milked. Many of today’s cash cows were yesterday’s stars. Cash cow divisions should be managed to maintain their strong position for as long as possible. Product development or diversification may be attractive strategies for strong cash cows. However, as a cash cow division becomes weak, retrenchment or divestiture can become more appropriate.

- Dogs—Divisions in Quadrant IV (lower right) have a low relative market share position and compete in a slow- or no-market-growth industry; they are dogs in the firm’s portfolio. Because of their weak internal and external position, these businesses are often liquidated, divested, or trimmed down through retrenchment. When a division first becomes a dog, retrenchment can be the best strategy to pursue because many dogs have bounced back, after strenuous asset and cost reduction, to become viable, profitable divisions.
The basic BCG Matrix appears in Figure 6-7. Each circle represents a separate division. The size of the circle corresponds to the proportion of corporate revenue generated by that business unit, and the pie slice indicates the proportion of corporate profits generated by that division.
The major benefit of the BCG Matrix is that it draws attention to the cash flow, investment characteristics, and needs of an organization’s various divisions. The divisions of many firms evolve over time: dogs become question marks, question marks become stars, stars become cash cows, and cash cows become dogs in an ongoing counterclockwise motion. Less frequently, stars become question marks, question marks become dogs, dogs become cash cows, and cash cows become stars (in a clockwise motion). In some organizations, no cyclical motion is apparent. Over time, organizations should strive to achieve a portfolio of divisions that are stars.
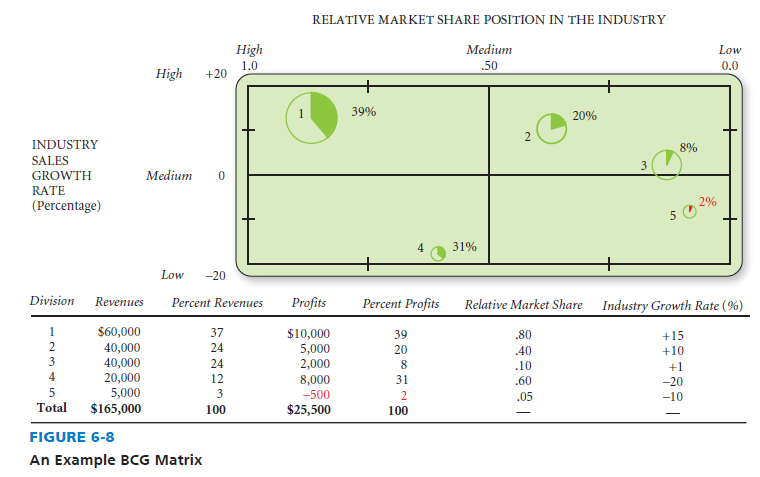
An example of a BCG Matrix is provided in Figure 6-8, which illustrates an organization composed of five divisions with annual sales ranging from $5,000 to $60,000. Division 1 has the greatest sales volume, so the circle representing that division is the largest one in the matrix. The circle corresponding to Division 5 is the smallest because its sales volume ($5,000) is least among all the divisions. The pie slices within the circles reveal the percent of corporate profits contributed by each division. As shown, Division 1 contributes the highest profit percentage, 39 percent, as indicated by 39 percent of the area within circle 1 being shaded. Notice in the diagram that Division 1 is considered a star, Division 2 is a question mark, Division 3 is also a question mark, Division 4 is a cash cow, and Division 5 is a dog.
The BCG Matrix, like all analytical techniques, has some limitations. For example, viewing every business as a star, cash cow, dog, or question mark is an oversimplification; many businesses fall right in the middle of the BCG Matrix and thus are not easily classified. Furthermore, the BCG Matrix does not reflect if various divisions or their industries are growing over time; that is, the matrix has no temporal qualities, but rather it is a snapshot of an organization at a given point in time. Finally, other variables besides relative market share position and industry growth rate in sales, such as size of the market and competitive advantages, are important in making strategic decisions about various divisions.
Another example BCG Matrix is provided in Figure 6-9. As you can see, Division 5 had an operating loss of $188 million.
Source: David Fred, David Forest (2016), Strategic Management: A Competitive Advantage Approach, Concepts and Cases, Pearson (16th Edition).
Having read this I thought it was very informative. I appreciate you taking the time and effort to put this article together. I once again find myself spending way to much time both reading and commenting. But so what, it was still worth it!