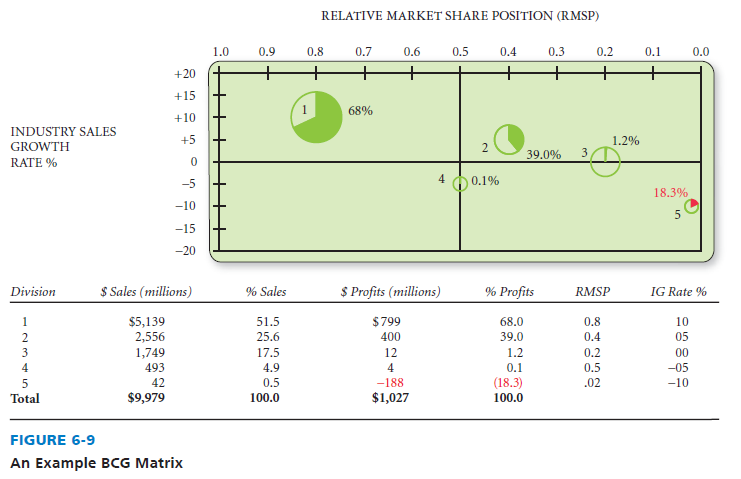
The Internal-External (IE) Matrix positions an organization’s various divisions (segments) in a nine-cell display, illustrated in Figure 6-10. The IE Matrix is similar to the BCG Matrix in that both tools involve plotting a firm’s divisions in a schematic diagram; this is why they are both called portfolio matrices. Also, in both the BCG and IE Matrices, the size of each circle represents the percentage of sales contribution of each division, and pie slices reveal the percentage of profit contribution of each division. But there are four important differences between the BCG Matrix and the IE Matrix, as follows:
- The x and y axes are different.
- The IE Matrix requires more information about the divisions than does the BCG Matrix.
- The strategic implications of each matrix are different. For these reasons,
- The IE Matrix has nine quadrants versus four in a BCG Matrix.
For the previous four reasons, strategists in multidivisional firms often develop both the BCG Matrix and the IE Matrix in formulating alternative strategies. A common practice is to develop a BCG Matrix and an IE Matrix for the present, and then develop projected matrices to reflect expectations of the future. This before-and-after analysis can be very effective in an oral presentation, enabling students (or strategists) to pave the way for (justify or give some rationale for) their recommendations across divisions of the firm.
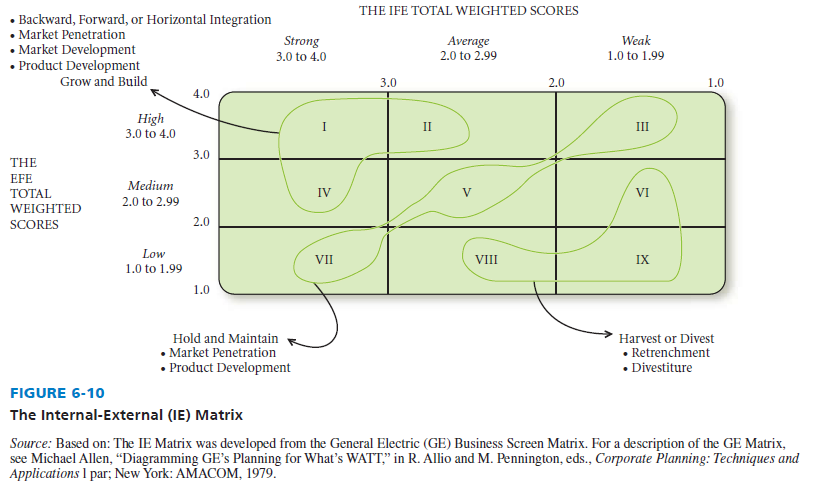
The IE Matrix is based on two key dimensions: (1) the IFE total weighted scores on the x-axis and (2) the EFE total weighted scores on the y-axis. Recall that each division of an organization should construct an IFE Matrix and an EFE Matrix for its part of the organization, but oftentimes in performing case analysis, strategic-management students are asked to simply estimate divisional IFE and EFE scores, rather than prepare those underlying matrices for every division. Anyway, the total weighted scores derived from the divisions allow construction of the corporate-level IE Matrix. On the x-axis of the IE Matrix, an IFE total weighted score of 1.0 to 1.99 represents a weak internal position; a score of 2.0 to 2.99 is considered average; and a score of 3.0 to 4.0 is strong. Similarly, on the y-axis, an EFE total weighted score of 1.0 to 1.99 is considered low; a score of 2.0 to 2.99 is medium; and a score of 3.0 to 4.0 is high. Circles, representing divisions, are positioned in an IE Matrix based on their (x, y) coordinate.
Despite having nine cells (or quadrants), the IE Matrix has three major regions that have different strategy implications, as follows:
- Region 1—The prescription for divisions that fall into cells I, II, or IV can be described as grow and build. Intensive (market penetration, market development, and product development) or integrative (backward integration, forward integration, and horizontal integration) strategies can be most appropriate for these divisions. This is the best region for divisions, given their high IFE and EFE scores. Successful organizations are able to achieve a portfolio of businesses positioned in Region 1.
- Region 2—The prescription for divisions that fall into cells III, V, or VII can be described as hold and maintain strategies; market penetration and product development are two commonly employed strategies for these types of divisions.
- Region 3—The prescription for divisions that fall into cells VI, VIII, or IX can be described as harvest or divest.
An example of a four-division IE Matrix is given in Figure 6-11. As indicated by the positioning of the four circles, grow and build strategies are appropriate for Divisions 1, 2, and 3. But Division 4 is a candidate for harvest or divest. Division 2 contributes the greatest percentage of company sales and thus is represented by the largest circle. Division 1 contributes the greatest proportion of total profits; it has the largest-percentage pie slice.


An example five-division IE Matrix is given in Figure 6-12. Note that Division 1 has the largest revenues (as indicated by the largest circle) and the largest profits (as indicated by the largest pie slice) in the matrix. It is common for organizations to develop both geographic and product-based IE Matrices to more effectively formulate strategies and allocate resources among divisions. Firms often prepare a “before and after” IE (or BCG) Matrix to reveal the situation at present versus the expected situation after one year. This latter idea minimizes the limitation of these matrices being a “snapshot in time.”
The Academic Research Capsule 6-1 discusses some thoughts on a new IE Matrix.
A New IE Matrix
Portfolio analysis is critically significant in strategic planning because allocation of resources across divisions is arguably the most important strategic decision facing multidivisional firms each year. Two recent journal articles merged the EFE and IFE Matrices with the CPM to propose a new External Competitive Profile Matrix (ECPM) and an Internal Competitive Profile Matrix (ICPM). In their articles cited in the source, Cassidy, Glissmeyer, and Capps present a revised IE Matrix developed based on the new ECPM and ICPM scores. Cassidy, Glissmeyer, and Capps contend that the new nine-cell matrix improves on Fred David’s original IE Matrix, first offered in 1987 and based on the General Electric (GE) Business Screen.
Source: Based on C. Cassidy, M. Glissmeyer, & C. Capps III, “Mapping an Internal-External (IE) Matrix Using Tradition and Extended Matrix Concepts,” Journal of Applied Business Research, 29, no. 5 (September/ October 2013): 1523-1528. See also C. Capps III and M. Glissmeyer, “Extending the Competitive Profile Matrix Using Internal Factor Evaluation and External Factor Evaluation Matrix Concepts,” Journal of Applied Business Research, 28, no. 5 (2012): 1062
Source: David Fred, David Forest (2016), Strategic Management: A Competitive Advantage Approach, Concepts and Cases, Pearson (16th Edition).
I think other website proprietors should take this website as an model, very clean and wonderful user genial style and design, let alone the content. You’re an expert in this topic!