Marketing research in retailing entails the collection and analysis of information relating to specific issues or problems facing a retailer. At farsighted firms, marketing research is just one element in a retail information system. At others, marketing research may be the only type of data gathering and processing.
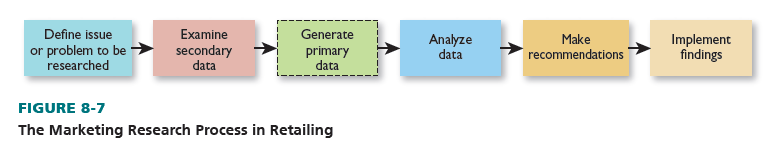
The marketing research process embodies a series of activities: defining the issue or problem to be studied, examining secondary data, generating primary data (if needed), analyzing data, making recommendations, and implementing findings. It is not a single act; rather, it is a systematic process. Figure 8-7 outlines the research process. Each activity is done sequentially. Secondary data are not examined until after an issue or problem is defined. In Figure 8-7, the dashed line around the primary data stage means these data are generated only if secondary data do not yield actionable information. The process is described next.
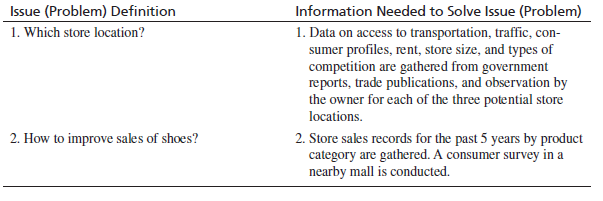
Issue (problem) definition involves a clear statement of the topic to be studied. What information does the retailer want to obtain to make a decision? Without clearly knowing the topic to be researched, irrelevant and confusing data could be collected. Here are examples of issue definitions for a shoe store. The first one seeks to compare three locations and is fairly structured; the second is more open-ended: (1) “Of three potential new store locations, which should we choose?” (2) “How can we improve the sales of our men’s shoes?”
When secondary data are involved, a retailer looks at data that have been gathered for purposes other than addressing the issue or problem currently under study. Secondary data may be internal (such as company records) or external (such as government reports and trade publications). When primary data are involved, a retailer looks at data that are collected to address the specific issue or problem under study. This type of data may be generated via survey, observation, experiment, and simulation.
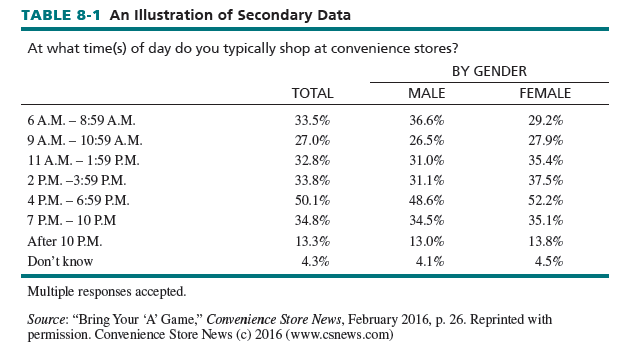
Convenience Store News conducted a study of what time of day people most often visit convenience stores. Its 2016 “Realities of the Aisle” consumer research studied 1,501 people who shopped at least one time in the prior month. By the time you read this, the data in Table 8-1 will be secondary data in nature.19
Secondary data are sometimes relied on; other times, primary data are crucial. In some cases, both are gathered. It is important that retailers keep these points in mind: (1) There is great diversity in the possible types of data collection (and in the costs). (2) Only data relevant to the issue being studied should be collected. (3) Primary data are usually acquired only if secondary data are inadequate (thus, the dashed box in Figure 8-7). Both secondary and primary data are described further in the next sections.
These kinds of secondary and primary data can be gathered for the shoe store issues recently stated:
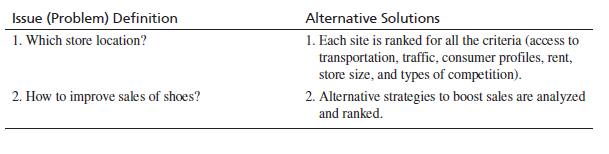
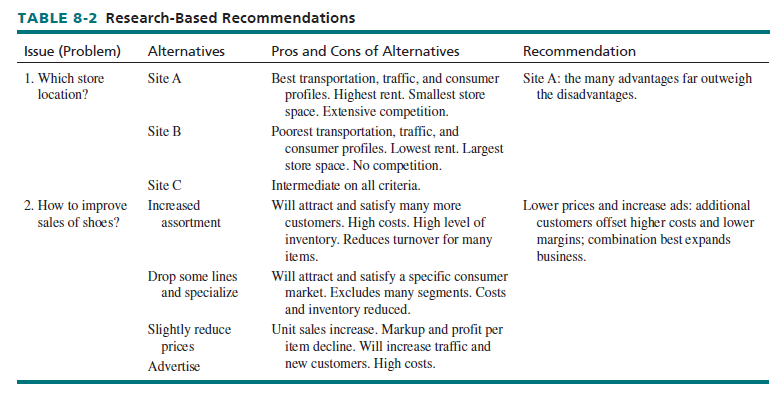
After data are collected, data analysis is performed to assess that information and relate it to the defined issue. Alternative solutions are also clearly outlined. For example:
At this point, the pros and cons of each alternative are enumerated. See Table 8-2. Recommendations are then made as to the best strategy for the firm. Of the available options, which is best? Table 8-2 also shows recommendations for the shoe-store issues discussed in this section.
Last, but not least, the recommended strategy is implemented. If research is to replace intuition in strategic retailing, a decision maker must follow the recommendations from research studies, even if those results seem to contradict his or her own ideas.
Let’s now look at secondary data and primary data in greater depth.
1. Secondary Data
ADVANTAGES AND DISADVANTAGES Secondary data have several advantages:
- Data assembly is inexpensive. Company records, trade journals, and government publications are all rather low cost. No data collection forms, interviewers, and tabulations are needed.
- Data can be gathered quickly. Company records, library sources, and Web sites can be accessed immediately. Many firms store reports in their retail information systems.
- There may be several sources of secondary data—with many perspectives.
- A secondary source may possess information that would otherwise be unavailable to the retailer. Government publications often have statistics no private firm could acquire.
- When data are assembled by a source such as Progressive Grocer, Nielsen, Stores, or the government, results are usually quite credible.
- The retailer may have only a rough idea of the topics to investigate. Secondary data can then help define issues more specifically. In addition, background information about a given issue can be gathered from secondary sources before undertaking a primary study.
Secondary data also have several potential disadvantages:
- Available data may not suit the purposes of the current study because they have been collected for other reasons. Neighborhood statistics may not be found in secondary sources.
- Secondary data may be incomplete. A service station owner would want car data broken down by year, model, and mileage driven, so as to stock parts. A motor vehicle bureau could provide data on the models but not the mileage driven.
- Information may be dated. Statistics gathered every 2 to 5 years may not be valid today. The S. Census of Retail Trade is conducted every 5 years. Furthermore, there is often a time delay between the completion of a census and the release of information.
- The accuracy of secondary data must be carefully reviewed. A retailer needs to decide if the data have been compiled in an unbiased way. The purpose of the research, the data collection tools, and the method of analysis should each be examined—if they are available for review.
- Some secondary data sources are known for poor data collection methods; they should be avoided. When data conflict, the source with the best reputation for accuracy should be used.
- In retailing, many secondary data projects are not retested and the user of secondary data has to hope results from one narrow study are applicable to his or her firm.
Whether secondary data resolve an issue or not, their low cost and availability require that primary data not be amassed until after studying secondary data. Only if secondary data are not actionable should primary data be collected. We now cite secondary data sources for retailers.
SOURCES There are many sources and types of secondary data. The major distinctions are between internal and external sources.
Internal secondary data are available within the company, sometimes from the data bank of a retail information system. Before searching for external secondary data or primary data, the retailer should look at information available inside the firm.
At the beginning of the year, most retailers forecast and develop budgets for the next 12 months. This helps outline planned spending for that year. A firm’s prior budget and its success in reaching budgetary goals are good sources of secondary data in forming a new budget.
Retailers use sales and profit-and-loss reports to judge performance. Many have data from electronic registers that can be studied by store, department, and item. By comparing data with prior periods, a firm gets a sense of growth or contraction. Overdependence on sales data may be misleading. Sales should be examined along with profit-and-loss data to indicate strengths and weaknesses in operations and management and to help lead to improvements.
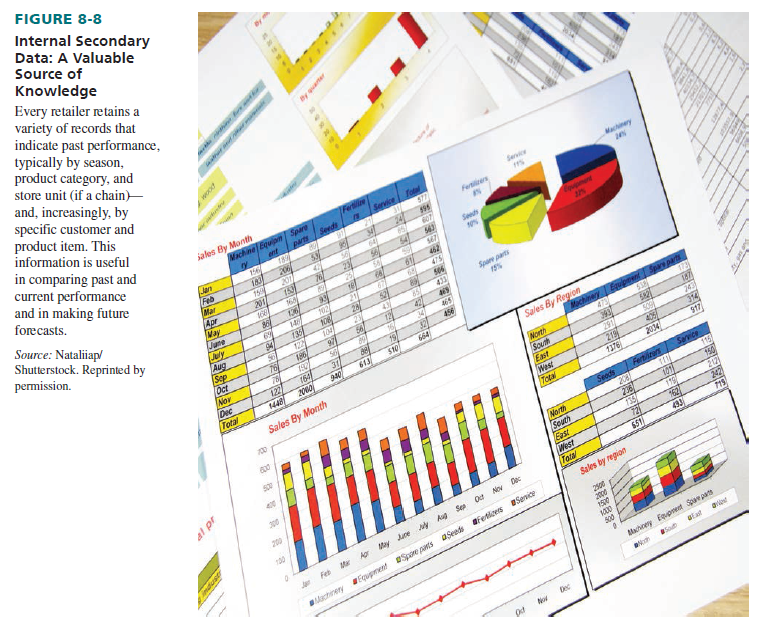
Through customer billing reports, a retailer learns about inventory movement, sales by different personnel, and sales volume. For credit customers, sales by location, repayment time, and types of purchases can be reviewed. Purchase invoices show the retailer’s own buying history and enables the retailer to evaluate itself against budgetary goals. See Figure 8-8.
Inventory records indicate the merchandise carried throughout the year and the turnover of these items. Knowing the lead time to place and receive orders from suppliers, as well as the extra inventory kept on hand to prevent running out at different times over the year, aids planning.
If a firm does primary research, the resultant report should be kept for future use (hopefully in the retail information system). When used initially, a report involves primary data. Later reference to it is secondary in nature since the report is no longer used for its primary purpose.
Written reports on performance are another source of internal secondary data. They may be prepared and filed by senior executives, buyers, sales personnel, or others. All phases of retail management can be improved through formal report procedures.
External secondary data are available from sources outside the firm. They should be consulted if internal information is insufficient for a decision to be made on a defined issue. These sources are comprised of government and nongovernment categories.
To use external secondary data well, appropriate online databases should be consulted. They contain all kinds of written materials, usually by subject or topic heading, for a specified time. Here are several databases, chosen for their retailing relevance. They are typically available through the Internet (for online access, you must use your company, college, or local library Web connection—direct entry to the sites is password-protected):
- Academic Search Premier/EBSCOhost
- Business Source Premier/EBSCOhost
- Dow Jones Factiva
- Gale’s Business & Company Resource Center
- Gale Virtual Reference Library
- Ingenta Connect
- LexisNexis Academic Universe
- Mergent Online
- Plunkett Research Online
- Standard & Poor’s NetAdvantage
The government distributes many materials. Here are publications chosen for their retailing value. They are available in a business library or other large library or through the Web:
- Annual Retail Trade Survey
- Consumer Expenditure Survey (Quarterly)
- S. Census of Retail Trade (Every 5 years ending in 2 and 7)
- S. Census of Service Industries (Every 5 years ending in 2 and 7)
- Monthly Retail Trade and Food Services Sales
- S. Survey of Current Business
- Other (Registration data such as births, deaths, automobile registrations, etc. Available through federal, state, and local agencies.)
Government agencies, such as the Federal Trade Commission, provide online pamphlets on topics such as franchising, unit pricing, deceptive ads, and credit policies. The Small Business Administration provides smaller retailers with online literature and advice. Pamphlets are distributed free or sold for a nominal fee.
Nongovernment secondary data come from many sources, often cited in reference guides. Major nongovernment sources are regular periodicals; books, monographs, and other nonregular publications; channel members; and commercial research houses.
Regular periodicals are available at most libraries or by personal subscription. A growing number are also available online; some Web sites provide free information, whereas others charge a fee. Periodicals may have a broad scope (such as Fortune) and discuss diverse business topics, or they may be narrower (such as Chain Store Age) and deal mostly with retail topics.
Many firms publish books, monographs, and other nonregular retailing materials. Some, such as Pearson Higher Education (www.pearsonhighered.com), have textbooks and practitioner books. The American Marketing Association (www.ama.org) offers information to enhance readers’ business knowledge. The Better Business Bureau (www.bbb.org) wants to improve the public’s image of business and expand industry self-regulation. The International Franchise Association (www .franchise.org) and the National Retail Federation (www.nrf.com) describe industry practices and trends, and they act as spokespersons to advocate the best interests of members. Other associations can be uncovered by consulting Gale’s Encyclopedia of Associations.
Retailers may also get information from channel partners such as ad agencies, franchise operators, manufacturers, and wholesalers. When those firms do research for their own purposes and offer some or all of the findings to their retailers, external secondary data are involved. Channel partners pass on findings to enhance their own sales and retailer relations. They usually do not charge for the information.
The last external source is the commercial research house that conducts ongoing studies and makes results available to many clients for a fee. This source is secondary if the retailer is a subscriber and does not request tailored studies. Information Resources Inc., Nielsen, and Standard Rate & Data Service provide subscriptions at lower costs than a retailer would incur if data were collected only for its use.
Our blog (www.bermanevansretail.com) has posts on online sources of free external secondary data—both government and nongovernment.
2. Primary Data
ADVANTAGES AND DISADVANTAGES After exhausting available secondary data, a defined issue may still be unresolved. In this instance, primary data (collected to resolve a specific topic at hand) are needed. When secondary data are sufficient, primary data are not collected. There are several advantages associated with primary data:
They are collected to fit the retailer’s specific purpose.
- Information is current.
- The units of measure and data categories are designed for the issue being studied.
- The firm either collects data itself or hires an outside party. The source is known and controlled, and the methodology is constructed for the specific study.
- There are no conflicting data from different sources.
- When secondary data do not resolve an issue, primary data are the only alternative.
There are also several possible disadvantages often associated with primary data:
- They are normally more expensive to obtain than secondary data.
- Information gathering tends to be more time-consuming.
- Some types of information cannot be acquired by an individual firm.
- If only primary data are collected, the perspective may be limited.
- Irrelevant information may be collected if the issue is not stated clearly enough.
In sum, a retailer has many criteria to weigh when evaluating the use of primary data. In particular, specificity, currency, and reliability must be balanced against high costs, time, and limited access to materials. A variety of primary data sources for retailers are discussed next.
SOURCES The first decision is to determine who collects the data. A retailer can do this itself (internal) or hire a research firm (external). Internal collection is usually quicker and cheaper. External collection is usually more objective and formal. Second, a sampling method is specified. Instead of gathering data from all stores, all products, and all customers, a retailer may obtain accurate data by studying a sample of them. This saves time and money. With a probability (random) sample, every store, product, or customer has an equal or known chance of being chosen for study. In a nonprobability sample, stores, products, or customers are chosen by the researcher—based on judgment or convenience. A probability sample is more accurate but is also more costly and complex. Third, the retailer chooses among four methods of data collection: survey, observation, experiment, and simulation. All of the methods are capable of generating data for each element of a strategy.
SURVEY With a survey, information is systematically gathered from respondents by communicating with them. Surveys are used in many retail settings. In a low-key, interactive manner, Sunglass Hut surveys its shoppers and encourages them to share their experiences through an interactive device known as Social Sun. Food Lion uses in-store surveys to learn how satisfied customers are and what their attitudes are on various subjects.
A survey may be conducted in person, over the phone, by mail, or online. Typically, a questionnaire is used. A personal survey is face-to-face, flexible, and able to elicit lengthy responses; unclear questions can be explained. It may be costly, and interviewer bias is possible. A phone survey is fast and rather inexpensive. Responses are often short, and nonresponse may be a problem. A mail survey can reach a wide range of respondents, has no interviewer bias, and is not costly. Slow returns, high nonresponse rates, and participation by incorrect respondents are potential problems. An online survey is interactive, can be adapted to individuals, and yields quick results. Yet, only certain customers shop online or answer online surveys. The technique chosen depends on the goals and requirements of the research project.
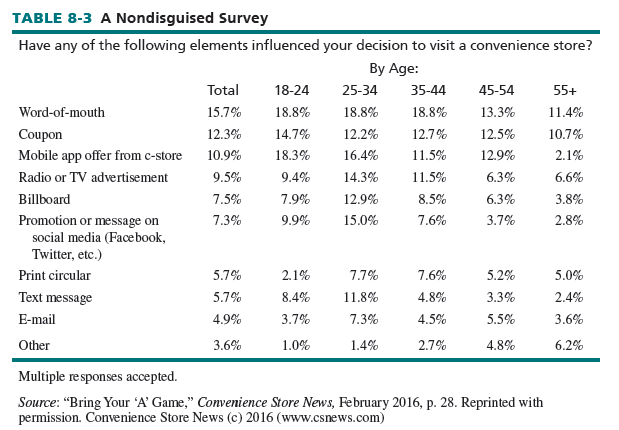
A survey may be nondisguised or disguised. In a nondisguised survey, the respondent is told the real purpose of the study. In a disguised survey, the respondent is not told the true purpose so that person does not answer what he or she thinks a firm wants to hear. Disguised surveys use word associations, sentence completions, and projective questions (such as, “Do your friends like shopping at this store?”). See Table 8-3.
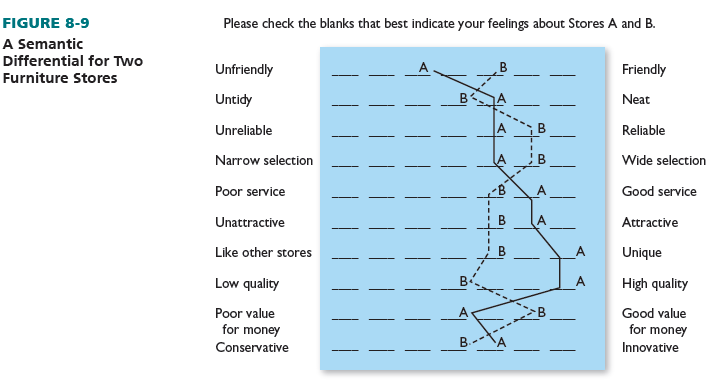
The semantic differential—a listing of bipolar adjective scales—is a survey format that may be disguised or nondisguised. A respondent is asked to rate one or more retailers on several criteria, each evaluated by bipolar adjectives (such as unfriendly-friendly). By computing the average rating of all respondents for each criterion, an overall profile emerges. Figure 8-9 shows a semantic differential comparing two furniture retailers. Retailer A is a prestigious, high-quality store and retailer B is a mid-quality, family-run store. The semantic differential graphically portrays their images.
OBSERVATION The form of research in which present behavior or the results of past behavior are noted and recorded is known as observation. Because people are not questioned, observation may not require respondent cooperation, and survey biases are minimized. Observation may be used in real situations. The key disadvantage of observation is that attitudes are not elicited.
Retailers use observation to determine the quality of sales presentations (by having researchers pose as shoppers), to monitor related-item buying, to determine store activity by time and day, to make pedestrian and vehicular traffic counts (to measure the potential of new locations), and to determine the proportion of patrons using mass transit.
With mystery shoppers, retailers or their market research partners hire people to pose as customers and observe a service or a brand through visits, telephone calls, or Web site interactions. These mystery shoppers may evaluate operations, customer service experience, compliance with service standards, product availability, price, service calls, sales presentations, and how well store environments and displays are maintained. Some firms prefer video mystery shopping to address complex and challenging aspects of a service business.20
Observation may be disguised or nondisguised, structured or unstructured, direct or indirect, and human or mechanical. In disguised observation, the shopper or company employee is not aware he or she is being watched by a two-way mirror or hidden camera. In nondisguised observation, the participant knows he or she is being observed—such as a department manager watching a cashier’s behavior. Structured observation calls for the observer to note specific behavior. Unstructured observation requires the observer to note all of the activities of the person being studied. With direct observation, the observer watches people’s present behavior. With indirect observation, the observer examines evidence of past behavior, such as food products in consumer pantries. Human observation is carried out by people. It may be disguised, but the observer may enter biased notations and overlook behavior. Mechanical observation, such as a camera filming in-store shopping, eliminates viewer bias and does not miss behavior.
EXPERIMENT An experiment is a type of research in which one or more elements of a retail strategy mix are manipulated under controlled conditions. An element may be a price, a shelf display, store hours, or some other feature. If a retailer wants to find the effects of a price change on sales, only one item’s price is varied. Other strategic elements (location, quantity, etc.) stay the same, so the true price effect is measured.
An experiment may use survey or observation techniques to record data. In a survey, questions are asked about the experiment: Did you buy Brand Z because of its new shelf display? Are you buying more ice cream because it’s on sale? In observation, behavior is watched during the experiment: Sales of Brand Z rise by 20 percent when a new display is used. Ice cream sales go up 25 percent during a special sale.
Surveys and observations are experimental if they occur under controlled situations. When surveys ask broad attitude questions or unstructured behavior is observed, experiments are not involved. Experimentation can be difficult because many uncontrollable factors (such as weather, competition, and the economy) come into play. A well-controlled experiment yields good data.
The major advantage is an experiment’s ability to show cause and effect (a lower price results in higher sales). It is also systematically structured and enacted. The major potential disadvantages are high costs, contrived settings, and uncontrollable factors.
SIMULATION A type of experiment whereby a computer program is used to manipulate the elements of a retail strategy mix rather than test them in a real setting is called simulation. Two kinds of simulation are now being applied in retail settings: those based on mathematical models and those involving “virtual reality.”
In the first kind of simulation, a model of the expected controllable and uncontrollable retail environment is constructed. Factors—such as effects of a price cut or longer store hours—are manipulated by computer (rather than the marketplace) so their effect on the overall strategy and specific elements of it are determined. No consumer cooperation is needed, and combinations of factors can be analyzed in a controlled, rapid, inexpensive, and risk-free manner. This format is gaining popularity as reliable software is increasingly available. However, it is still somewhat difficult to use.
In the second kind of simulation, a retailer devises or buys interactive software that lets participants simulate actual behavior in as realistic a format as possible. This approach creates a “virtual shopping environment.” For example, Facebook’s Oculus Rift VR headset now makes it possible to render virtual shopping environments at lower costs; and the glasses can be enhanced with eye-tracking capability to make it an efficient shopper research tool. SMI studies on the virtual shopper journey using EEGs (which test the electrical activity of the brain) have had participants use eye-tracking and real-time consumer behavior in a virtual setting to assess the impact of in-store campaigns on buying decisions and how consumers interact with merchandise displays and package design before deciding to buy. Participants virtually interact with signs and products displayed in the VR headset as a natural experience; findings can be used to devise real-life store campaigns. The simulated space can easily compare several conditions (A/B testing) of in-store campaigns and shelf placements.21
Source: Barry Berman, Joel R Evans, Patrali Chatterjee (2017), Retail Management: A Strategic Approach, Pearson; 13th edition.
I have been examinating out some of your stories and i must say pretty good stuff. I will make sure to bookmark your blog.