Once researchers have collected sociometric data (data that measures links between individuals), and so know which actors have links with which other actors, they then need to reconstitute the network, or networks, of actors before they can conduct a global network analysis (or analyses). The methods of analysis fall into two main categories. In the first, the researcher’s aim is to identify homogenous groups within the network. In the second, the focus is on individual particularities and the researcher concentrates on each actor’s position within the network.
1. Formalizing Data, and Initial Analyses
1.1. From adjacency matrix to sociogram
In most cases, computer software is used to process data. The first step is to put the data into the form of a matrix. A matrix is produced for each type of relationship (supervision, work, friendship, influences, financial flow, flow of materials, etc.). The matrix can then be used to obtain a graphic representation.
To construct an adjacency matrix, all of the actors involved are listed along both the columns and the rows of the matrix. If individual A has a relationship with individual B, a number 1 is placed in the corresponding space at the intersection of line a and column b. If the relationship is directed, its direction must be taken into account. For example, the researcher might study simply the fact that individual A worked with B during the previous three months, or they may study whether A supervised the activity of individual B during this period. In the first case, the working relationship is not directed. A and B worked together and the adjacency matrix is, therefore, symmetrical. The number 1 is placed at the intersection of line a and column b and at the intersection of line b and column a. In the case of the network of supervision, however, the relationship is directed. While A supervises B, B does not necessarily supervise A. The number 1 is simply placed at the intersection of line a and column b and one obtains a non-symmetrical adjacency matrix.
Once the adjacency matrix has been constructed, it can be represented in the form of a graph. The graph obtained in this way is a sociogram. Figure 14.1 gives an example of an adjacency matrix for a directed network, and its corresponding sociogram.
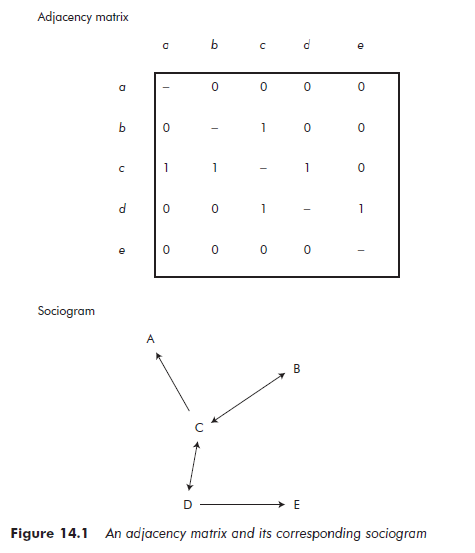
Sociograms enable us to make a certain number of summary interpretations, and can be sufficient for analyzing simple networks. In the example of Figure 14.1, we can immediately identify C as an important actor. If the relationship being studied is one of advice, C is probably an expert. If it is a supervision relationship, C is probably a departmental head. However, once the size of the networks involved increases, visual interpretation of the graph becomes particularly difficult. It also becomes hazardous in the sense that the choices made in arranging the elements of the graph have a strong influence on the way it can be interpreted. Researchers need standardized tools that enable systematic analysis.
1.2. General analyses
In analyzing the general structure of a network, indicators can help researchers to assess the overall reality of the structure of the relationships between individuals.
As an example of how indicators can be used, we present below the two most frequently used indicators: density and multiplexity. We will then show how a number of networks can be compared.
Density of a network In any given network, density corresponds to the relationship between the number of existing links and the number of possible links. By existing links we mean those that the researcher has been able to reveal. Possible links refer to all the links that could have existed, taking into account the number of individuals involved. Thus, for n individuals, there are n(n – 1)/2 possible links.
The density measurement does not say very much in itself. The researcher can simply make a subjective judgement on the value obtained. However, density becomes particularly interesting if we wish to compare different groups of individuals or different organizations.
To give an example, the communication network in Production Unit A of an organization may be more dense than that in Production Unit B. If we hypothesize that the density of the communication network is a factor of performance, we can conclude, from a descriptive viewpoint, that Unit A performs better than Unit B. We could also test this hypothesis by seeing if there is a link between the density of a department’s communications network and the evaluation that members of upper management make of that department’s performance.
Network multiplexity Multiplexity relates to the existence of different kinds of links between individuals. Let us take the example of the relationships within a group of company directors. Between the directors of two companies there can exist relationships of trust, friendship or even guidance. The more dimensions the relationship involves, the more it is said to be multiplex. If n is the number of different links existing between the units being studied (individuals, companies, etc.) and p is the number of units cited as being linked, the degree of multiplexity is the relationship n/p. This general indicator requires delicate handling. It does not take into account the distribution of multiplexity within the network – two networks can have the same degree of multiplexity but very different structures. For example, similar multiplexity is obtained in the two following cases. In the first case, a minority of individuals have very multiplex links (that is, involving direction, influence, assistance and advice) while the others have simple links. In the second case, most of the individuals have just two kinds of link (for example, assistance and advice).
Other indices It is possible to compare networks using other means than general indices that measure either density or multiplexity. Researchers can assess how much overlap there is between the networks. Software packages can calculate the number of common links between adjacency matrices. Random networks can be generated and compared to the empirical data. This comparison enables researchers to assess the specific nature of the data they collect: does the network obtained have a direction (an underlying order) or does it present the same characteristics as a network constructed ‘by chance’? Software packages can also carry out statistical internetwork analyses. Ucinet IV, for example, can analyze the correlation between two different networks. This tool can be used to test whether it is relevant to use relationships about which there is available information to approximate relationships that are difficult to evaluate. For example, is it relevant, in a given context, to evaluate the trust between a network’s units (information that is difficult to collect on a wide scale) from the flow of information between them? If, when using a test sample, we notice that the network of trust is strongly correlated with the telephone communications network (taken as a proxy for information flow), then the answer is yes.
2. Grouping Methods
Analyzing the general structure of a network provides useful initial information, but researchers quite often need to go beyond this type of analysis. There are a series of methods available that enable researchers to group together individuals within a network. Using these methods, they can identify collective actors, according to an essential grouping principle: cohesion. A second principle, that of equivalence, is used to group together individuals who occupy similar positions within the network.
2.1. Strongly cohesive groups
The principle of cohesion involves grouping together individuals within a network on the basis of them being ‘close’ to each other – of distinguishing subgroups by their strong density. Research into subgroups within a network corresponds in general terms to a desire to reveal the existence of ‘collective’ actors (for example, a dominant coalition) within an organization, and to study how the relationships between these actors are structured.
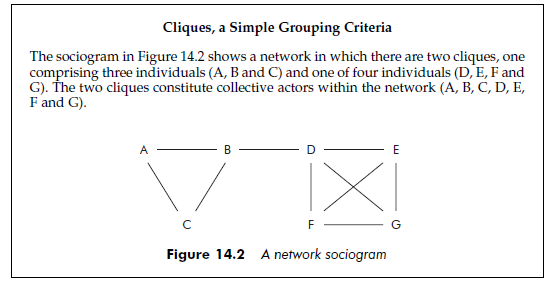
A ‘collective’ actor is often represented in the world of networks by a clique – a set of individuals who are all interconnected. In the example below we present a sociogram of cliques. Within a clique, links are direct (all the individuals are linked to each other, without an intermediary). Generally, for a clique to exist at all, all the individuals must be connected by strong links. This means that if the relationship is directed, the links must go in both directions (from A towards B and from B to A). However, it is possible to define subgroups using indirect links. This is the case when one reveals an w-clique. In an w-clique, all the individuals are connected by a number of links that is less than w. This means that the link between two individuals in the w-clique passes at most by (w – 1) individuals. N-cliques enable researchers to find organizational subgroups using criteria that are less strict than those governing cliques. Another approach consists of disregarding the direction of a directed relationship, in which case weak components are obtained. However, neither the w-clique nor the clique of weak components are really satisfactory. They are rarely meaningful in organizational reality. The criteria used actually make it difficult to interpret the groups that are constituted. How, for example, can a researcher constitute a group while disregarding the direction of a supervision relationship? Or how can a group be defined around the concept of links that are longer than 1 (the length being defined by the number of links, or degrees, separating two units)?
However, there is a real need to find ‘collective actors’ within networks using more flexible criteria than those of the clique (direct and strong links) and without resorting to simplistic solutions like those of n-cliques or weak components (Frank, 1995).
The most commonly used software packages offer one solution to this, by either establishing criteria about the minimum number of interactions each actor must have with the other actors in the group, or by fixing a maximal value for the number of missing interactions. Another, similar, criterion involves establishing how many individuals must be removed from the group for its members to become disconnected (Borgatti et al., 1992). In this way the researcher isolates those blocs in the matrix that necessitate the removal of n individuals to become disconnected.
Other commonly used criteria include co-membership of cliques. The fact that two individuals belong to a significant number of the same cliques is considered to be an indication of their social closeness. The criterion of comembership of cliques, or any other closeness criterion, can be applied systematically by means of ascendant algorithms (grouping begins from individual) or descendant algorithms (starting from the whole of the network which is then subdivided). These algorithms can vary in their degree of sophistication. Software packages offer solutions using these criteria and the appropriate algorithms in different ways. Some of the procedures enable this type of grouping to be effected for valued graphs.
When using this type of grouping method, a common problem is the frequent need to fix limits for the criteria used. Limits should be fixed according to the context, without referring to any objective criteria. Moreover, using limits does not always enable groups to be formed without overlap (Frank, 1995). It may be preferable to choose methods that involve fixing a limit that corresponds to the data used rather than those that require an arbitrary limit.
With all these methods, the principle is to maximize the intra-group interactions and minimize those that are intergroup. A vast range of possibilities is available to the researcher – it is not possible for us to describe here all the procedures that exist in the literature. However, it seems that, in practice, there are relatively few procedures that can be used for any particular type of data. In fact, restrictions are frequently made on the type of data that can be used for each of the procedures proposed by software packages. For example, the procedure presented below is suitable for a valued network, but not for a directed graph.
2.2. Equivalence classes
Researchers can also try to group together individuals that have the same kind of links with other members of the network. This is called equivalence. However, the members of an equivalence class are not necessarily linked to each other. The example below presents a study using the notion of structural equivalence.
Grouping by equivalence classes can be used to take into account the concept of social role and status. If we take the example of the different positions held within a company, we can suppose that each worker has similar relationships with individuals in other classes (executives, senior managers, floor managers, etc.). Grouping by equivalence classes allows us to identify classes of individuals who play the same role, independently of the one formally defined by their status and job description.
The main point of this process is to create classes that are defined not in themselves, but according to the relationship that links their members to other individuals. We can distinguish between structural, regular and automorphic equivalence.
Structural equivalence occurs when all the elements of one class have relationships with all the members of another class. In the army, for example, all the subordinates must show respect for their superiors.
Regular equivalence corresponds to the situation in which, if a member of class 1 is linked to a member of class 2, all the members of class 1 must have a link with at least one member of class 2, and all the members of class 2 must have a link with at least one member of class 1. In a factory, for example, each supervisor is in charge of at least one worker and each worker is under the charge of at least one supervisor.
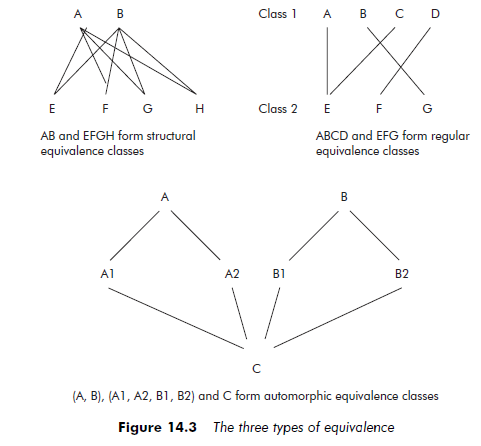
Two individuals belong to the same automorphic equivalence class if it is possible to switch their positions in the network around and reconstitute a network that is isomorphic to the original – that is, with exactly the same form as the initial network. This situation arises when the networks of two actors are exactly symmetrical. One can imagine, for example, two project managers in a company finding themselves in a situation of automorphic equivalence.
It seems clear that the type of equivalence sought depends directly on the problem being studied and the research question. Figure 14.3 illustrates structural, regular and automorphic equivalence.
In reality, it is rare to find classes that correspond precisely to any one of these three types of equivalence, and the strict application of one of the three definitions only rarely results in classes that can be interpreted in terms of social roles. It is generally more relevant to use one of the many statistical approximation procedures that software programs offer, and we will now give an overview of these.
A number of these procedures are designed to respect the logic of structural equivalence. This postulates that members of a single class within a network all have exactly the same links with the other actors in the network. This means that the adjacency matrix rows for these actors will be identical. The statistical approximation methods most often used in this case consist of grouping actors that resemble each other the most into one class. To do this, the closeness of the individuals is evaluated – by calculating, for example, a Euclidean distance, a correlation coefficient, or the number of common links shared by rows of the adjacency matrix. Once this has been achieved, the individuals are put into groups with the aid of a classification method (see Chapter 13 for a discussion of classification methods). This type of process can be applied to valued graphs or used when researching multiplex relationships.
Other algorithmic procedures aim to approach regular equivalence. They proceed by making successive comparisons of all the pairs of individuals. The researcher compares each pair of individuals with all the other pairs in the network and then evaluates whether they can be placed in the same equivalence class. These comparisons serve as a basis for calculating an index showing the closeness between pairs. A classification method can then be used.
There are also several ways of grouping together individuals according to the principles of automorphic equivalence. For example, it is possible to use geodesic equivalence to approximate automorphic equivalence. The geodesic path is the shortest path between two individuals. It is represented by its length (the number of links separating two units). Geodesic approximation involves calculating the length of the geodesic paths that link each individual to each of the other individuals in the network. Two individuals are considered to be equivalent if they present the same types of geodesic path; for example, if they are both linked to two individuals by a path of length 1, to three others by a path of length 2, etc.
Researchers are advised to be particularly careful when deciding upon the methods they will use to approach equivalence. While many methods can be used with valued graphs, these may not always be applicable to non-valued graphs.
3. Methods for Demonstrating the Notion of Centrality
Another aim of network analysis is to concentrate on particular actors and establish the role that their structural position permits them to play within the organization.
Literature on networks often focuses on individuals in central positions. We can generally suppose that the actors who play a key role within the network are able to draw a certain advantage from it. There are many ways of defining centrality and the corresponding algorithms vary in their degree of sophistication.
Freeman (1979) draws a distinction between centrality of degree, of closeness and of ‘betweenness’.
Centrality of degree Centrality of degree corresponds to the number of connections an individual has. Individuals are considered to be central if they are strongly connected to other members of the network. In other words, the
centrality of degree index for each individual A is equal to the number of direct relationships he or she has. This index is purely local. It depends neither on the characteristics of the network as a whole, nor on the characteristics of the other individuals to which individual A is linked. However, an individual who has numerous links with marginal individuals is much less central than an individual whose links are with individuals who are themselves central. To resolve this difficulty, an index of relative or normed centrality is calculated for each individual, by dividing the absolute centrality scores by the maximal centrality possible for the graph. This concept is explained below.
Centrality of closeness Centrality of closeness is an assessment of an individual’s centrality through an evaluation of their closeness to all the other individuals in a network. It is a more global measurement, which takes into account not only the connections individuals have with their immediate neighbors, but also their closeness to all the other members of the network.
One measurement used is the sum of the geodesic distances linking one point to all the other points of the graph. Geodesic distance is the shortest path linking two individuals on a graph. The centrality of an individual can be measured by comparing its total geodesic distance from other individuals with that of other actors in the network – the smaller the figure, the greater the individual’s centrality. As we demonstrate below, other measurements based on the same principle have been also been proposed.
Centrality of ‘betweenness’ Evaluation of centrality can also be based on the individual’s role as a ‘go-between’. Freeman (1979) proposed that an individual may be only slightly connected to others (weak centrality of degree), but prove to be an essential intermediary in exchanges. An individual’s ‘betweenness’ vis-a-vis two other people is defined by the frequency with which he or she appears on the geodesic path or paths (that is, of minimal length) linking the two others. The values of the centrality index of ‘betweenness’ vary between 0 and 1, and can be compared between different networks.
Other measurements of centrality As Hage and Harary (1995) have shown, models of centrality using the concepts of centrality of degree, closeness and ‘betweenness’, have been used in many research works; studying power in informal exchange networks (Hage and Harary, 1983) and social stratification in commercial networks (Hunt, 1988; Irwin, 1983; Milicic, 1993). Nonetheless, the authors also proposed supplementary measures.
In the case of a network where each individual is linked to at least one other individual, Hage and Harary (1995) propose introducing the idea of eccentricity. By eccentricity, the two authors mean the maximal distance that separates a given individual from other individuals. Using the notion of eccentricity, one can calculate the diameter of a network, which is equal to the maximal eccentricity existing within it. Similarly, the notion of radius is understood as the minimal eccentricity. An individual is, therefore, central if his or her eccentricity is equal to the radius of the network. Another way of measuring centrality was proposed by Bonacich (1987).
For comparative purposes, the researcher needs to be in a position to judge the network’s overall centralization. There is a marked difference between being a unit at the center of a decentralized network and one at the center of a centralized network. When judging the network as a whole, therefore, we talk about its centralization. This indicator always varies between 0 and 1, and indicates the degree to which the maximal centrality is greater than the centrality of all the other points. When it equals 0, all the centralities are equal. When it equals 1, one point dominates the centralization of the network. This situation corresponds to a star.
Source: Thietart Raymond-Alain et al. (2001), Doing Management Research: A Comprehensive Guide, SAGE Publications Ltd; 1 edition.
this is a unique piece of writing