1. Patterns
How do you recognize a pattern? Basically speaking, a true pattern is one that is shared by members of the group (their actual behavior) and/or one that is believed to be desirable, legitimate, or proper by the group (their ideal behavior). We can systematize the recognition of patterns by going through the following steps:
- Consider each statement made by someone in the community you are studying. Was it: (a) made to others in everyday conversation, or (b) elicited by you in an interview?
- For each of those two conditions, consider whether it was: (a) volunteered by the person, or (b) directed in some way by you.
- Consider each activity that you have observed. Did it: (a) occur when you were alone with a single individual, or (b) occur when you were in the presence of a group?
- For each of those two conditions, consider whether: (a) the person or group acted spontaneously, or (b) acted because of some prompt on your part.
In general, public statements and actions are more likely to reflect the ideal behavior of the group than are those expressed in private. Statements and activities that occur spontaneously or are volunteered by the people in the community are more likely to be elements in a shared pattern than are those somehow prompted by the researcher.
When conducting ethnographic research in the field, we always have to remember that we are not in control of all the elements in the research process: we are capturing life as it is being lived, and hence we must be aware that things that might appear meaningful to us as outsiders might or might not be equally meaningful to the people who live in the community being studied – and vice versa. Social scientists (anthropologists in particular) refer to the two perspectives on meaning as the emic and the etic. These terms come from the field of linguistics, where phonemic analysis refers to the delineation of sounds that convey meaning to native speakers of a language while phonetic analysis converts all sounds into a kind of international code system that allows for the comparative understanding of meanings. So in the simplest sense, an ‘emic’ perspective on social and cultural data is that which looks for the patterns, themes, and regularities as they are perceived by the people who live in the community; an ‘etic’ per- 68 spective is one that is applied by the researcher (who will have at least read about, if not actually conducted first-hand fieldwork in many other communities) interested in seeing how what goes on locally compares to things happening elsewhere.
Field-based researchers try to engage in a constant validity check, which basically involves switching back and forth between emic and etic perspectives. Like so many other processes that we have discussed, constant validity checking seems like a reasonably straightforward, intuitive activity; the trick, as usual, is to learn to do it in a systematic fashion. There are some important elements in the process:
- Look for both consistencies and inconsistencies in what knowledgeable informants tell you; probe for why people living in the same community might disagree about matters that seem to be significant to them.
- Check what people in the community say about behaviors or events against other evidence, if available (e.g. newspaper accounts, reports by others who have conducted fieldwork in the same community, or one very similar to it). But remember that even if what people say is factually ‘wrong’, their views are not irrelevant; try to find out why they persist in holding ‘erroneous’ views.
- Be open to ‘negative evidence’. If a case arises that doesn’t fit your own emerging etic view, try to find out why this discrepancy exists. Is it the result of simple variation within the culture of the community? Does it reflect your own lack of knowledge about the community? Is it a true anomaly that would stick out even in an emic perspective (see Flick, 2007b)?
- Play with alternative explanations for patterns that seem to be emerging. Do not wed yourself to a single analytical framework before all the data are in hand.
2. The process of data analysis
There is no single formula accepted by all ethnographic researchers that can serve as a strategy for the analysis of data collected in the field (see Gibbs, 2007). Indeed, some scholars have made the point that the analysis of data (quantified data excepted) is necessarily ‘custom-built’ to suit the particular needs of specific projects. Ethnographic data analysis may thus seem to be more of an art than a science and certainly ethnographers have been accused of being ‘soft’ scientists (i.e. intuitive and impressionistic, rather than rigorous in their analysis). But there is more regularity in their approaches than might initially be apparent, and several important points are found in most formulations of the process. They may be taken as an outline for an acceptable framework for analysis. Keep in mind, however, that the ‘steps’ in this framework need not happen in a strictly sequential order. They may happen simultaneously, or some of them may have to be repeated in the course of the research.
- Data management. As noted in the previous chapter, it is essential to keep clearly organized field notes. More and more contemporary ethnographers find it convenient to keep their notes in the form of computer files. But low- tech field workers are still to be found (sometimes because the circumstances of their field settings are not congenial to the use of computers, other times simply out of habit and preference) using paper file folders or index cards. I personally like to use loose-leaf notebooks with category dividers, which keep notes all in one place but allow for them to be moved as needed. No one method is better than any other – it all depends on how you like to work. The most important thing is that you be able to find and retrieve data once you have filed it, regardless of what your filing format might be (see Gibbs, 2007, for a further discussion of these matters).
- Overview reading. It is usually a good idea to read through your notes before proceeding with more formal analysis. There may be details you have forgotten since you first collected the data, and an overview reading will refresh your memory. It will also stimulate you to begin reflecting on what you think you now know, and to begin asking questions about what you still want to understand.
- Clarification of categories. Begin with a description of what you have seen in your notes. Then move to a classification of the notes, a process of taking apart the narrative description and identifying categories or themes. Sometimes you can identify themes on the basis of your review of the scholarly literature on the topic(s) you are investigating. Keep in mind that the ‘literature’ pertinent to your study includes theoretical analyses and methodological explorations in addition to ethnographies in similar communities. In other cases, you will have no preconceived themes, but allow them to emerge from your reading of the data. In either case, begin with no more than six themes. If you have too many themes, every incident forms its own category and you have gained nothing; if you have too few themes, you risk conflating statements or behaviors that might prove to be distinct. You can always reconfigure your thematic categories as you go along, but in a preliminary pass-through you need something to get you started.
In the Trinidad study, I was able to draw upon a fairly extensive body of existing literature on the international Indian indenture. From that literature I identified several key themes that were helpful in organizing my own data: the loss of caste; changes in family structure; the role of traditional religions; economic opportunities in the post-indenture period; political relations between Indians and others in the post-colonial society; secondary migration (i.e. second- or third- generation Indians leaving the place of indenture for England, Canada, or the United States). I organized my notebook using these themes as major categories. Upon reading my notes in preparation for analysis of the final results, I realized what I had already begun to suspect: that the first category was more or less a non-issue among the Trinidad Indians, and that except for Brahmins (the religious specialists) not even the most elderly people could accurately remember their traditional caste affiliations and no one seemed very concerned that this supposed pillar of Indian culture had disappeared over the generations of the indenture. So other than affirming that, yes, there had been a ‘loss of caste’ in the community I had studied, just as there had been in other communities studied in other parts of the overseas Indian world, I had little in my notes to sustain this as a usable category. On the other hand, alcoholism had clearly emerged as an overriding issue. My many notes on interviews and observations of AA meetings that were scattered through the existing categories were taken out and put in their own separate category. It thus became possible to compare and contrast alcoholism against such predisposing factors as religion, family, and economic and political relationships. The generation of these categories was initially ‘etic’ because they derived from the comparative literature on the indenture. But the later modifications of the categories reflected an ‘emic’ emphasis, responding as they did to what my informants had demonstrated to me as being important to them.
In the deinstitutionalization study, I opted against using ready-made categories based on the existing literature since so much of the literature derived from clinically based research and/or research conducted among the professional caretakers of people with mental disabilities. My own ethnographic study of the people themselves would undoubtedly yield a somewhat different perspective. So during the course of my research I kept my notes in the form of a running narrative somewhat like a diary (minus the personal reflections, which I reserved to a separate private journal). I also kept separately transcriptions of each extended interview. Such a format would obviously be unusable when the time came to write up my findings, and so it was necessary to do a very thorough overview reading and then define the categories that jumped out, namely: sexuality; finding and keeping a job; relations with family; relations with friends; relations with professionals; world-views (i.e. how they saw themselves and interpreted their place in the ‘wider scheme of things’). The generation of these categories was almost entirely ‘emic’ since it was guided for the most part by what the people had told me.
- Presentation of data. With the data arranged into useful categories, it is possible to summarize them in text, tabular, or figure form (or some combination of those formats). There are several commonly used presentation forms.
- The ‘comparison table’ or matrix. This can be as simple as a 2 x 2 table that compares two segments of a population in terms of one of the categories, e.g.
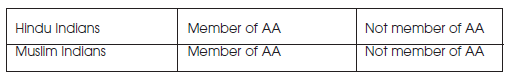
-
- The actual cells would be filled with descriptive text as well as numbers in this case. Such a table made it clear (in a way that was much less obvious in the raw notes) that on a numerical level there were more Muslims in AA than would be expected from the simple demographics. In the general population, Hindus accounted for approximately 80 per cent of the Indian population, while Muslims made up approximately 15 per cent, the remainder being Christian converts. But Muslims accounted for 35 per cent of the Indian AA membership, while Hindus were at 60 per cent, with the remainder Christian. The accompanying text helped explain why Muslims were relatively more attracted to AA. In interviews, many of them commented on the fact that as a subcommunity within the larger Indian population they had always considered themselves ‘more progressive’ than the Hindus, and they saw joining AA as a ‘modern’ response to their problem. Those comments did not stand out until placed in this comparison table in which the numbers indicated an unexpected pattern, which the narrative text helped explicate.
- The hierarchical tree. This diagram shows different levels of abstraction. The top of the tree represents the most abstract information and the bottom the least abstract. For example, in explaining the indenture, the highest level of abstraction reflected two large-scale perspectives: the political-economic (conditions relative to the powerlessness of colonized people and to the specific deprivations resulting from decades of servitude) and the psychological (conditions relative to the loss of traditional cultural identity-markers). A middle level reflected the kinds of stress that are found in a transplanted, economically exploited, politically disenfranchised population (e.g. a perceived disparity between the group’s aspirations and the social resources available to realize those aspirations). At the bottom were the specific data relative to the experiences of the Indians in Trinidad in whose community I was a participant observer.
- Hypotheses or propositions. These statements of relationship need not be formally tested (as in quantitative research), but arranging the thematic elements in the data in such a format can certainly clarify the ways the perceived variables fit together. For example, I could state the proposition that adult men with mental retardation who have active family ties are more apt to complete their community habilitation programs than are those with weak ties. Since I was obviously in no position to identify, let alone examine, anything near to a statistically representative sample of adult men with mental retardation, I could not hope to test this hypothesis in a meaningful way. But the simple statement of relationship was a way of organizing my data and understanding the life experiences of the men I was able to work with.
- Metaphors. Metaphors are literary devices, shorthand ways of expressing relationships. (I like to think of them as poetic versions of hypotheses.) For example, one of my AA informants used the phrase ‘inside is life, outside is death’. He was speaking specifically about AA because he believed that if he left the group he would certainly go back to drinking and that doing so would kill him. But I also understood him to be reflecting a more general attitude among Indians, who found security in their own community and saw the outside world as a political, economic, and cultural threat. For Indians, ‘inside’ included family, religion, and jobs in the sugar industry as well as AA, while ‘outside’ included the political system of modern Trinidad, jobs in the oil industry, and hospital-based forms of rehabilitation. My informant’s metaphorical division of the world proved to be a very useful way to sort out my own data, and I ultimately used the phrase ‘outside is death’ as the title of the book that came from that research project. In a somewhat more blunt use of metaphors, one of the men in the community retardation program told me in some exasperation, ‘My life is a toilet.’ He meant that he counted as a waste everything he had ever done. One could take the remark at face value as nothing more than a cry of frustration or desperation. But it was also possible to use it as a key to unlock a whole set of observational and interview data: Why was life a waste? It became clearer to me in interrogating that metaphor that this man – and many of his compatriots – considered life a waste because they were not truly adult (not ‘real people’, as they often said). They were not trusted to do the things adults do (including most definitely to express their sexuality) and so everything they did was by definition childish and worthless.
So we can summarize the analysis process as follows beginning with the descriptive analysis phase:
- Organize notes, using thematic categories drawn from the literature if possible.
- Read through the notes and modify categories as necessary.
- Sort data into the modified categories.
- Count the number of entries in each category for purposes of descriptive statistical analysis (if the sample is large enough to permit it).
- Look for patterns in textual materials, using a variety of presentation formats as aids.
Next, we can consider the theoretical analysis:
- Consider the patterns in light of existing literature.
- Demonstrate how your findings relate to the interpretations of others. (Your findings may confirm what is already known and add new illustrative examples to an established perspective. Or they may run counter to the expectations and thus stimulate further research. Either option is a legitimate and praiseworthy outcome; see also Gibbs, 2007, for analyzing qualitative data).
2. A note on the use of computers in ethnographic data analysis
In relatively small-scale research projects, the amount of data may be manageable manually, i.e. it might be possible simply to ‘eyeball’ patterns. But projects that generate a very large amount of data can certainly benefit from one of the several computer software programs now available that are designed to aid the process of analysis (see Gibbs, 2007).
The most basic computer function for researchers is word processing. Programs such as Word or Word Perfect do not merely serve when it comes to writing up final reports. They also allow users to create text-based files, and to find, move, reproduce, and retrieve sections of those texts. Word processing is also important when it comes to transcribing interviews, keeping track of field notes, and coding text for purposes of indexing and retrieval.
Word processing is familiar to most of us nowadays, but there are other kinds of software that might be of assistance to the ethnographic researcher. Text retrievers (e.g. Orbis, ZylNDEX) specialize in locating each occurrence of a specified word or phrase; they can also locate combinations of these items in multiple files. Textbase managers (e.g. Tabletop) refine the text retrieval function and have an enhanced capacity for the organization of textual data. Code-and-retrieve programs (QUALPRO, Ethnograph) assist researchers in dividing text into manageable sections, which can then be sorted. Code-based theory builders (e.g. ATLAS/ti, NUD.IST) go beyond code-and-retrieve functions and permit the development of theoretical connections between and among coded concepts, resulting in relatively high-order classifications and connections. Conceptual network builders (e.g. SemNet) provide the capacity to design graphic networks in which variables are displayed as ‘nodes’ that are linked to one another using arrows or lines denoting relationships. (Weitzman and Miles, 1995, describe these computer-based research functions, although given the rapidity with which technology develops, the reader is well advised to consult up-to-date websites containing the most recent information about specific programs; see also Gibbs, 2007, for the use of software for qualitative analysis.)
Pros of computerized data analysis:
- The computer program itself is a form of organized data storage, making it that much easier to retrieve material.
- Sorting and searching for text is done automatically and in far less time than would be consumed doing so manually.
- The program requires a careful (virtually line-by-line) examination of the data. In ordinary reading, it is possible to skim and thus lose potentially important pieces of information.
Cons of computerized data analysis:
- There might be a steep (and time-inefficient) learning curve for new software programs. And let’s face it, some people are still just not comfortable around computers.
- Although they function best as adjuncts to traditional, manual means of analysis, computer programs tempt the researcher to let them do all the work.
- There are many data analysis programs now available to the ethnographic researcher, but they do not all do the same thing. It is possible to spend a lot of money acquiring a program and then spend a lot of time learning how to operate it, only to discover that it doesn’t really do what you need it to do. Do your homework about the programs before you commit yourself to one or another.
Source: Angrosino Michael (2008), Doing Ethnographic and Observational Research, SAGE Publications Ltd; 1st edition.
9 Aug 2021
9 Aug 2021
9 Aug 2021
9 Aug 2021
9 Aug 2021
9 Aug 2021