Managers who believe the customer is the company’s only true “profit center” consider the traditional organization chart in Figure 5.1(a)—a pyramid with the president at the top, management in the middle, and frontline people and customers at the bottom—obsolete.2
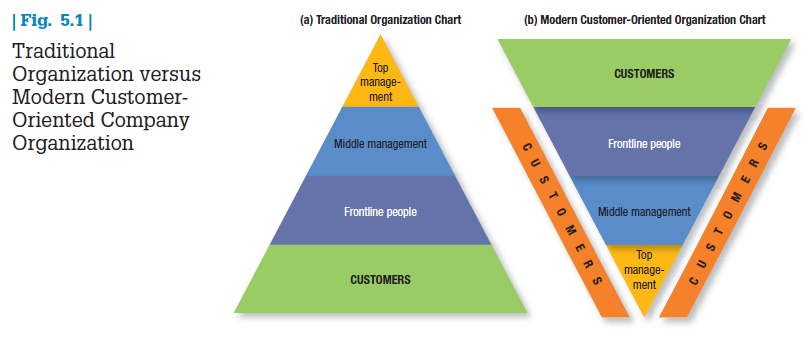
Successful marketing companies invert the chart to look like Figure 5.1(b). At the top are customers; next in importance are frontline people who meet, serve, and satisfy them; under them are the middle managers, whose job is to support the frontline people so they can serve customers well; and at the base is top management, whose job is to hire and support good middle managers. We have added customers along the sides of Figure 5.1(b) to indicate that managers at every level must be personally engaged in knowing, meeting, and serving customers.
Some companies have been founded on the customer-on-top business model, and customer advocacy has been their strategy—and competitive advantage—all along. With the rise of digital technologies, increasingly informed consumers expect companies to do more than connect with them, more than satisfy them, and even more than delight them. They expect companies to listen and respond to them.
When Office Depot added customer reviews to its Web site, revenue and sales conversion increased significantly. The company also incorporated review-related terms in its paid search advertising campaign. As a result of these efforts, Web site revenue and the number of new buyers visiting the site both increased by more than 150 percent.3
1. CUSTOMER-PERCEIVED VALUE
Consumers are better educated and better informed than ever, and they have the tools to verify companies’ claims and seek out superior alternatives. Even the best-run companies have to be careful not to take customers for granted, as Dell found out.
DELL Dell rode to success by offering low-priced computers, logistical efficiency, and after-sales service. The firm’s maniacal focus on low costs has been a key ingredient in its success. When it shifted its customer- service call centers to India and the Philippines to cut costs, however, understaffing frequently led to 30-minute waits for customers. Almost half the calls required at least one transfer. To discourage customer calls, Dell even removed its toll-free service number from its Web site. With customer satisfaction slipping, while competitors matched its product quality and prices and offered better service, Dell’s market share and stock price both declined sharply. Dell ended up hiring more North American call center employees. “The team was managing cost instead of managing service and quality,” Michael Dell confesses.
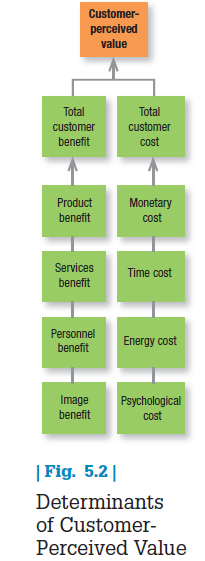
How do customers ultimately make choices? They tend to be value maximizers, within the bounds of search costs and limited knowledge, mobility, and income. Customers choose—for whatever reason—the offer they believe will deliver the highest value and act on it (Figure 5.2). Whether the offer lives up to expectation affects customer satisfaction and the probability that the customer will purchase the product again. In one survey asking U.S. consumers “Does [Brand X] give good value for what you pay?” the top ten-scoring brands were: Subway, Cheerios, Amazon, History Channel, Ford, Discovery Channel, Lowe’s, Olive Garden, YouTube, and Google.5
DEFINING VALUE Customer-perceived value (CPV) is the difference between the prospective customer’s evaluation of all the benefits and costs of an offering and the perceived alternatives. Total customer benefit is the perceived monetary value of the bundle of economic, functional, and psychological benefits customers expect from a given market offering because of the product, service, people, and image. Total customer cost is the perceived bundle of costs customers expect to incur in evaluating, obtaining, using, and disposing of the given market offering, including monetary, time, energy, and psychological costs.
Customer-perceived value is thus based on the difference between benefits the customer gets and costs he or she assumes for different choices. The marketer can increase the value of the offering by raising economic, functional, or emotional benefits and/or reducing one or more costs. The customer choosing between two value offerings, V1 and V2, will favor V1 if the ratio V1:V2 is larger than one, favor V2 if the ratio is smaller than one, and be indifferent if the ratio equals one.
APPLYING VALUE CONCEPTS Suppose the buyer for a large construction company wants to buy a tractor for residential construction from either Caterpillar or Komatsu. He wants the tractor to deliver certain levels of reliability, durability, performance, and resale value. The competing salespeople carefully describe their respective offers. The buyer decides Caterpillar has greater product benefits based on his perceptions of those attributes. He also perceives differences in the accompanying services—delivery, training, and maintenance—and decides Caterpillar provides better service as well as more knowledgeable and responsive staff. Finally, he places higher value on Caterpillar’s corporate image and reputation. He adds up all the economic, functional, and psychological benefits from these four sources—product, services, people, and image—and perceives Caterpillar as delivering greater customer benefits.
Does he buy the Caterpillar tractor? Not necessarily. He also examines his total cost of transacting with Caterpillar versus Komatsu, a cost that consists of more than money. As Adam Smith observed more than two centuries ago in The Wealth of Nations, “The real price of anything is the toil and trouble of acquiring it.” Total customer cost therefore also includes the buyer’s time, energy, and psychological costs expended in product acquisition, usage, maintenance, ownership, and disposal. The buyer evaluates these elements together with the monetary cost to form a total customer cost. Then he considers whether Caterpillar’s total customer cost is too high compared to total customer benefits. If it is, he might choose Komatsu. The buyer will choose whichever source delivers the highest perceived value.
Now let’s use this decision-making theory to help Caterpillar succeed in selling to this buyer. Caterpillar can improve its offer in three ways. First, it can increase total customer benefit by improving economic, functional, and psychological benefits of its product, services, people, and/or image. Second, it can reduce the buyers nonmonetary costs by reducing the time, energy, and psychological investment. Third, it can reduce its products monetary cost to the buyer.
Suppose Caterpillar concludes the buyer sees its offer as worth $20,000. Further, suppose Caterpillar’s cost of producing the tractor is $14,000. This means Caterpillar’s offer generates $6,000 over its cost, so the firm needs to charge between $14,000 and $20,000. If it charges less than $14,000, it won’t cover its costs; if it charges more, it will price itself out of the market.
Caterpillar’s price will determine how much value it delivers to the buyer and how much flows to Caterpillar. If it charges $19,000, it is creating $1,000 of customer-perceived value and keeping $5,000 for itself. The lower Caterpillar sets its price, the higher the customer’s perceived value and, therefore, the higher the customer’s incentive to purchase. To win the sale, the firm must offer more customer-perceived value than Komatsu does.6 Caterpillar is well aware of the importance of taking a broad view of customer value.7
CATERPILLAR Caterpillar has become a leading firm by maximizing total customer value in the construction equipment industry, despite challenges from a number of able competitors such as John Deere, Case, Komatsu, Volvo, and Hitachi and emerging ones such as LiuGong Machinery in China. First, Caterpillar produces high-performance equipment known for reliability and durability—key purchase considerations in heavy industrial equipment. The firm also makes it easy for customers to find the right product by providing a full line of construction equipment and a wide range of financial terms. Caterpillar maintains the largest number of independent construction-equipment dealers in the industry. These dealers all carry a complete line of Caterpillar products and are typically better trained and perform more reliably than competitors’ dealers. Caterpillar has also built a worldwide parts and service system second to none in the industry. Customers recognize all the value Caterpillar creates in its offerings, allowing the firm to command a premium price 10 percent to 20 percent higher than competitors’. Caterpillar also makes strategic acquisitions to acquire new customers, such as picking up mining equipment maker Bucyrus International for $8.6 billion in 2010. Despite a recession that brought hard times to its industry and battered many of its competitors’ finances, Caterpillar was one of the best-performing stocks among the 30 companies in the Dow Jones Industrial Average coming out of the recession.
Very often, managers conduct a customer value analysis to reveal the company’s strengths and weaknesses relative to those of various competitors. The steps in this analysis are:
- Identify the major attributes and benefits that customers value. Customers are asked what attributes, benefits, and performance levels they look for in choosing a product and vendors. Attributes and benefits should be defined broadly to encompass all the inputs to customers’ decisions.8
- Assess the quantitative importance of the different attributes and benefits. Customers are asked to rate the importance of different attributes and benefits. If their ratings diverge too much, the marketer should cluster them into different segments.
- Assess the company’s and competitors’ performances on the different customer values against their rated importance. Customers describe where they see the company’s and competitors’ performances on each attribute and benefit.
- Examine how customers in a specific segment rate the company’s performance against a specific major competitor on an individual attribute or benefit basis. If the company’s offer exceeds the competitor’s offer on all important attributes and benefits, the company can charge a higher price (thereby earning higher profits), or it can charge the same price and gain more market share.
- Monitor customer values over time. The company must periodically redo its studies of customer values and competitors’ standings as the economy, technology, and product features change.
CHOICE PROCESSES AND IMPLICATIONS Some marketers might argue the process we have described is too rational. Suppose the customer chooses the Komatsu tractor. How can we explain this choice? Here are three possibilities.
- The buyer might be under orders to buy at the lowest price.The Caterpillar salesperson’s task is then to convince the buyer’s manager that buying on price alone will result in lower long-term profits and customer value for the buyer’s company.
- The buyer will retire before the company realizes the Komatsu tractor is more expensive to operate.The buyer will look good in the short run; he is maximizing personal benefit. The Caterpillar salesperson’s task is to convince other people in the customer company that Caterpillar delivers greater customer value.
- The buyer enjoys a long-term friendship with the Komatsu salesperson.In this case, Caterpillar’s salesperson needs to show the buyer that the Komatsu tractor will draw complaints from the tractor operators when they discover its high fuel cost and need for frequent repairs.
The point is clear: Buyers operate under various constraints and occasionally make choices that give more weight to their personal benefit than to the company’s benefit.
Customer-perceived value is a useful framework that applies to many situations and yields rich insights. It suggests that the seller must assess the total customer benefit and total customer cost associated with each competitor’s offer in order to know how its own offer rates in the buyer’s mind. It also implies that the seller at a disadvantage has two alternatives: increase total customer benefit or decrease total customer cost. The former calls for strengthening or augmenting the economical, functional, and psychological benefits of the offering’s product, services, personnel, and image. The latter calls for reducing the buyer’s costs by reducing the price or cost of ownership and maintenance, simplifying the ordering and delivery process, or absorbing some buyer risk by offering a warranty.
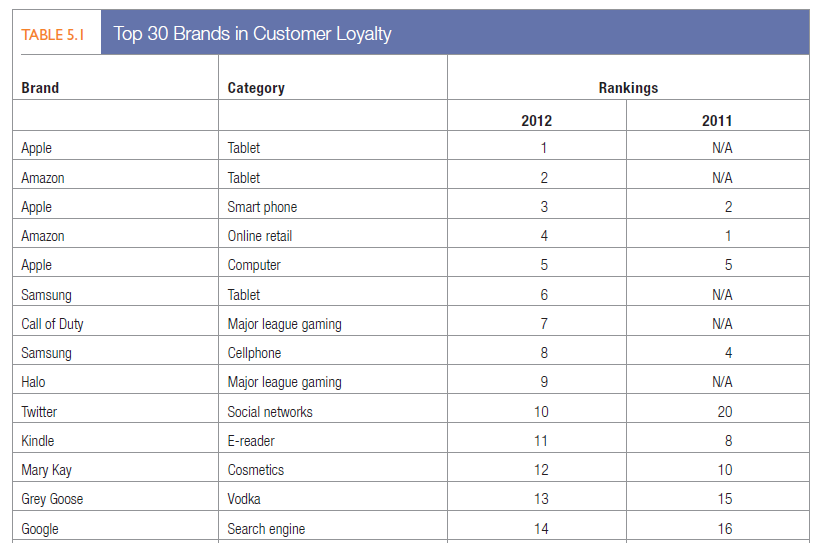
DELIVERING HIGH CUSTOMER VALUE Consumers have varying degrees of loyalty to specific brands, stores, and companies. Loyalty has been defined as “a deeply held commitment to rebuy or repatronize a preferred product or service in the future despite situational influences and marketing efforts having the potential to cause switching behavior.”9 Table 5.1 lists brands with the highest customer loyalty, according to one 2012 survey.
The value proposition consists of the whole cluster of benefits the company promises to deliver; it is more than the core positioning of the offering. For example, Volvo’s core positioning has been “safety,” but the buyer is promised more than just a safe car; other benefits include good performance, design, and safety for the environment. The value proposition is thus a promise about the experience customers can expect from the company’s market offering and their relationship with the supplier. Whether the promise is kept depends on the company’s ability to manage its value delivery system. The value delivery system includes all the experiences the customer will have on the way to obtaining and using the offering. At the heart of a good value delivery system is a set of core business processes that help deliver distinctive consumer value.10
2. TOTAL CUSTOMER SATISFACTION
In general, satisfaction is a person’s feelings of pleasure or disappointment that result from comparing a product or service’s perceived performance (or outcome) to expectations.11 If the performance or experience falls short of expectations, the customer is dissatisfied. If it matches expectations, the customer is satisfied. If it exceeds expectations, the customer is highly satisfied or delighted.12
Customer assessments of product or service performance depend on many factors, including the type of loyalty relationship the customer has with the brand.13 Consumers often form more favorable perceptions of a product with a brand they already feel positive about. Research has also shown an asymmetric effect of product performance and expectations on satisfaction: The negative effect on customer satisfaction of failing to meet expectations is disproportionally stronger than the positive effect of exceeding expectations.14
Although the customer-centered firm seeks to create high customer satisfaction, that is not its ultimate goal. Increasing customer satisfaction by lowering price or increasing services may result in lower profits. The company might be able to increase its profitability by means other than increased satisfaction (for example, by improving manufacturing processes or investing more in R&D).
The company also has many stakeholders, including employees, dealers, suppliers, and stockholders. Spending more to increase customer satisfaction might divert funds from increasing the satisfaction of other “partners.” Ultimately, the company must try to deliver a high level of customer satisfaction subject to also delivering acceptable levels to other stakeholders, given its total resources.
How do buyers form their expectations? Expectations result from past buying experience, friends’ and associates’ advice, public information and discourse, and marketers’ and competitors’ information and promises. If a company raises expectations too high, the buyer is likely to be disappointed. If it sets expectations too low, it won’t attract enough buyers (although it will satisfy those who do buy).15
Some of today’s most successful companies are raising expectations and delivering performances to match. Korean automaker Kia found success in the United States by launching low-cost, high-quality cars with enough reliability to offer 10-year, 100,000-mile warranties.
3. MONITORING SATISFACTION
Many companies are systematically measuring how well they treat customers, identifying the factors shaping satisfaction, and changing operations and marketing as a result.16
Wise firms measure customer satisfaction regularly because it is one key to customer retention.17 A highly satisfied customer generally stays loyal longer, buys more as the company introduces new and upgraded products, talks favorably to others about the company and its products, pays less attention to competing brands and is less sensitive to price, offers product or service ideas to the company, and costs less to serve than new customers because transactions can become routine.18
The link between customer satisfaction and customer loyalty is not proportional, however. Suppose customer satisfaction is rated on a scale from 1 to 5. At a very low level of satisfaction (level 1), customers are likely to abandon the company and even bad-mouth it. At levels 2 to 4, customers are fairly satisfied but still find it easy to switch when a better offer comes along. At level 5, the customer is very likely to repurchase and even spread good word of mouth about the company. High satisfaction or delight creates an emotional bond with the brand or company, not just a rational preference. Xerox’s senior management found its “completely satisfied” customers were six times more likely to repurchase Xerox products over the following 18 months than even its “very satisfied” customers.19
The company needs to recognize, however, that customers define good performance differently. Good delivery could mean early delivery, on-time delivery, or order completeness, and two customers can report being “highly satisfied” for different reasons. One may be easily satisfied most of the time, and the other might be hard to please but was pleased on this occasion.20 It is also important to know how satisfied customers are with competitors in order to assess “share of wallet” or how much of the customer’s spending the company’s brand enjoys: The more highly the consumer ranks the company’s brand in terms of satisfaction and loyalty, the more the customer is likely to spend on the brand.21
MEASUREMENT TECHNIQUES Periodic surveys can track customers’ overall satisfaction directly and ask additional questions to measure repurchase intention, likelihood or willingness to recommend the company and brand to others, and specific attribute or benefit perceptions likely to be related to customer satisfaction.
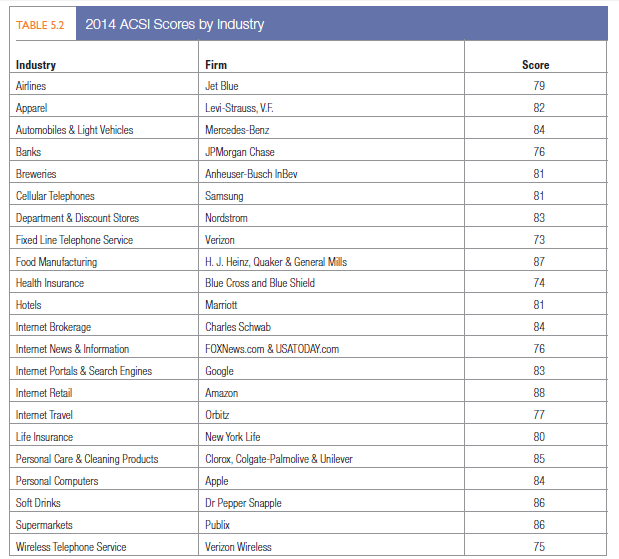
The University of Michigan’s Claes Fornell has developed the American Customer Satisfaction Index (ACSI) to measure consumers’ perceived satisfaction with different firms, industries, economic sectors, and national economies.22 Research has shown a strong and consistent association between customer satisfaction, as measured by ACSI, and firm financial performance in terms of ROI, sales, long-term firm value (Tobin’s Q), and other metrics.23 Table 5.2 displays some of the 2014 ACSI leaders. “Marketing Insight: Net Promoter and Customer Satisfaction” describes why some companies believe just one well-designed question is all that is necessary to assess customer satisfaction.24
Companies need to monitor their competitors’ performance too. They can monitor their customer loss rate and contact those who have stopped buying or who have switched to another supplier to find out why. Finally, as described in Chapter 3, companies can hire mystery shoppers to pose as potential buyers and report on strong and weak points experienced in buying the company’s and competitors’ products. Managers themselves can enter company and competitor sales situations where they are unknown and experience firsthand the treatment they receive, or they can phone their own company with questions and complaints to see how employees handle the calls.
INFLUENCE OF CUSTOMER SATISFACTION For customer-centered companies, customer satisfaction is both a goal and a marketing tool. Companies need to be especially concerned with their customer satisfaction level today because the Internet allows consumers to quickly spread both good and bad word of mouth to the rest of the world. Some customers set up their own Web sites to air grievances and galvanize protest, targeting high- profile brands such as United Airlines, Home Depot, and Mercedes-Benz.25
Companies that do achieve high customer satisfaction ratings make sure their target market knows it. Once they achieved number-one status in their category on J. D. Power’s customer satisfaction ratings, Hyundai, American Express, Medicine Shoppe (a chain pharmacy), and Alaska Airways, among others, communicated that fact.
4. PRODUCT AND SERVICE QUALITY
Satisfaction will also depend on product and service quality. What exactly is quality? Various experts have defined it as “fitness for use,” “conformance to requirements,” and “freedom from variation” We will use the American Society for Quality’s definition: Quality is the totality of features and characteristics of a product or service that bear on its ability to satisfy stated or implied needs.26 This is clearly a customer-centered definition. We can say the seller has delivered quality whenever its product or service meets or exceeds the customers’ expectations.
A company that satisfies most of its customers’ needs most of the time is called a high-quality company, but we need to distinguish between conformance quality and performance quality (or grade). A Lexus provides higher performance quality than a Hyundai: The Lexus rides more smoothly, accelerates faster, and runs problem-free longer. Yet both a Lexus and a Hyundai deliver the same conformance quality if all the units deliver their promised quality.
IMPACT OF QUALITY Product and service quality, customer satisfaction, and company profitability are intimately connected. Higher levels of quality result in higher levels of customer satisfaction, which support higher prices and (often) lower costs. Studies have shown a high correlation between relative product quality and company profitability.27 The drive to produce goods that are superior in world markets has led some countries to recognize or award prizes to companies that exemplify the best quality practices, such as the Deming Prize in Japan, the Malcolm Baldrige National Quality Award in the United States, and the European Quality Award.
Companies that have lowered costs to cut corners have paid the price when the quality of the customer experience suffers. British Airways also encountered turbulence when it became overly focused on cost cutting.28
BRITISH AIRWAYS Since 2012, British Airways has won no less than 35 major awards for its quality of service. Most recently, the airline won Best Airline, Best Short Haul Carrier, and Best Frequent Flyer Program at the Business Traveler Awards. In 2014, British Airways also scooped the Times Travel Award for Best Airline, the Conde Nast Traveller Award for Short Haul Airline of the Year, several Daily Telegraph awards, and the renowned Chinese Travel Industry Award for Best European Airline and the Superbrands Award for Consumer Superbrand.
For many global brands, such as British Airways, quality service is at the center of all their activities, but recognition of their efforts tends to come periodically since they are perceived as leaders in one year and ignored the next.
British Airways celebrated its 90th anniversary in 2009, as part of the International Airlines Group; it now has 40,000 employees including 15,000 cabin crew members, 3,600 pilots, and 5,500 engineers.
All this is in sharp contrast with the problems British Airways suffered between 1996 and 2009 when sharp budget cuts led to job losses, low employee morale, and strikes. Punctuality, customer service, and baggage handling all suffered during this time.
Total quality is everyone’s job, just as marketing is everyone’s job. Nevertheless, marketing plays an especially important role in helping companies identify and deliver high-quality goods and services to target customers. How do marketers help?
- They correctly identify customers’ needs and requirements.
- They communicate customer expectations properly to product designers.
- They make sure customers’ orders are filled correctly and on time.
- They check that customers have received proper instructions, training, and technical assistance in the use of the product.
- They stay in touch with customers after the sale to ensure they are, and remain, satisfied.
- They gather customer ideas for product and service improvements and convey them to the appropriate departments.
When marketers do all this, they make substantial contributions to total quality management and customer satisfaction as well as to customer and company profitability.
5. MARKETING INSIGHT Net Promoter and Customer Satisfaction
Many companies make measuring customer satisfaction a top priority, but how should they go about doing it? Bain’s Frederick Reichheld suggests only one customer question really matters: “How likely is it that you would recommend this product or service to a friend or colleague?”
Reichheld was inspired in part by the experiences of Enterprise Rent-A-Car. When the company cut its customer satisfaction survey in 1998 from 18 questions to two—one about the quality of the rental experience and the other about the likelihood customers would rent from the company again—it found those who gave the highest ratings to their rental experience were three times as likely to rent again than those who gave the second-highest rating. The firm also found that diagnostic information managers collected from dissatisfied customers helped it fine-tune its operations.
In a typical Net Promoter survey that follows Reichheld’s thinking, customers are given a 1-to-10 scale on which to rate their likelihood of recommending the company. Marketers then subtract Detractors (those who gave a 0 to 6) from Promoters (those who gave a 9 or 10) to arrive at the Net Promoter Score (NPS). Customers who rate the brand with a 7 or 8 are deemed Passively Satisfied and are not included. A typical set of NPS scores falls in the 10 percent to 30 percent range, but world-class companies can score over 50 percent. Some firms with top NPS scores in 2014 included USAA (82 percent), Amazon (64 percent), Southwest (62 percent), Wegmans (61 percent), Apple (72 percent), and Costco (82 percent).
Reichheld has picked up many believers through the years. American Express, Dell, and Microsoft, among others, have all adopted the NPS metric. GE has tied 20 percent of its managers’ bonuses to its NPS scores. When the European unit of GE Healthcare scored low, follow-up research revealed that response times to customers were a major problem. After it overhauled its call center and put more specialists in the field, GE Healthcare’s Net Promoter scores jumped 10 to 15 points. Philips has focused on engaging Promoters as well as addressing the concerns of Detractors, developing a Reference Promoter program to get customers willing to recommend the brand to actually do so through taped testimonials.
Reichheld says he developed NPS in response to overly complicated—and thus ineffective—customer surveys. So it’s not surprising that client firms praise its simplicity and strong relationship to financial performance. When Intuit applied Net Promoter to its TurboTax product, feedback revealed dissatisfaction with the software’s rebate procedure. After Intuit dropped the proof-of-purchase requirement, sales jumped 6 percent.
Net Promoter is not without critics. A common criticism is that many different patterns of responses may lead to the same NPS. For example, NPS equals 20 percent when Promoters equal 20 percent, Passives equal 80 percent, and Detractors equal 0 percent, as well as when Promoters equal 60 percent, Passives equal 0 percent, and Detractors equal 40 percent, but the managerial implications of the two patterns of responses are very different. Another common criticism is that it is not a useful predictor of future sales or growth because it ignores important cost and revenue considerations.
Others question its actual research support. One comprehensive academic study of 21 firms and more than 15,000 consumers in Norway failed to find NPS superior to any other metrics such as the ACSI measure. Some have criticized both NPS and ACSI measures for not fully accounting for ex-customers or those who were never customers. Peoples’ opinions about any of the single items or indices measuring customer satisfaction depend in part on how they value the trade-off between simplicity and complexity.
Sources: Fred Reichheld, Ultimate Question: For Driving Good Profits and True Growth (Cambridge, MA: Harvard Business School Press, 2006); Fred Reichheld, “The One Number You Need to Grow,” Harvard Business Review, December 2003; Neil A. Morgan and Lopo Leotte Rego, “The Value of Different Customer Satisfaction and Loyalty Metrics in Predicting Business Performance,” Marketing Science 25 (September-October 2006), pp. 426-39; Timothy L. Keiningham, Lerzan Aksoy, Bruce Cooil, and Tor W. Andreassen, “Linking Customer Loyalty to Growth,” MIT Sloan Management Review (Summer 2008), pp. 51-57; Suhail Khan, “How Philips Uses Net Promoter Scores to Understand Customers,” HBR Blog Network, May 10, 2011; Robert East, Jenni Romaniuk, and Wendy Lomax, “The NPS and ACSI: A Critique and an Alternative Metric,” International Journal of Market Research 53, no. 3 (2011), pp. 327-45; Randy Hanson, “Life after NPS,” Marketing Research (Summer 2011), pp. 8-11; Jenny van Doorn, Peter S. H. Leeflang, and Marleen Tijs, “Satisfaction as a Predictor of Future Performance: A Replication,” International Journal of Research in Marketing 30 (September 2013), pp. 314-18; www.satmetrix.com.
Source: Kotler Philip T., Keller Kevin Lane (2015), Marketing Management, Pearson; 15th Edition.
Hi there! This post couldn’t be written any better! Reading through this post reminds me of my previous room mate! He always kept talking about this. I will forward this article to him. Pretty sure he will have a good read. Thank you for sharing!
You are my aspiration, I own few blogs and sometimes run out from to brand.