1. Paired comparisons
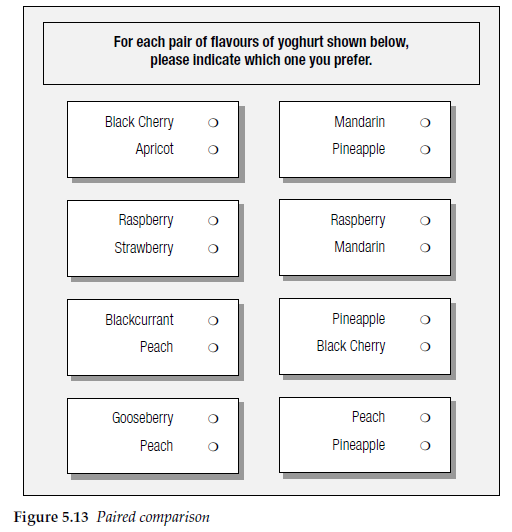
With paired comparisons, respondents are asked to choose between two objects based on the appropriate criterion, eg that one is more important than the other or preferred to the other. This can be repeated with a number of pairs chosen from a set of objects, such that every object is compared against every other object (see Figure 5.13). Summing the choices made provides an evaluation of importance or preference across all of the objects. This can be easier and sometimes quicker for respondents than being asked to rank-order a list of objects, because the individual judgements to be made are simpler.
By careful rotation of the pairs, some of the order bias inherent in showing lists can be avoided.
The disadvantage of this technique is that it is limited to a relatively small number of objects. With just six objects, 15 pairs are required if every object is to be assessed against every other one, and the number of pairs required increases geometrically. With 190 possible pairs from a list of 20 items, clearly no respondent can be shown all of them. A balanced design of the pairs shown to each respondent can provide sufficient information for the rank order of each item to be inferred.
2. Constant sum
With a constant sum technique, respondents are asked to allocate a fixed number of points between a set of options to indicate relative importance or relative preference. The number of points given to each option reflects the magnitude of the importance, from which we can also deduce the rank order of the options for each respondent (see Figure 5.14).
Some respondents are likely to have problems with a constant sum question, as it requires some effort and mental agility on their part, both to think simultaneously across all of the items and to do the mental arithmetic.

It is easier with electronic questionnaires, where the scores allocated can be automatically summed and the respondent not allowed to move on until exactly 100 points have been allocated. The need to make simultaneous comparisons between a number of different objects still remains, though. As the number of items increases, so it becomes more difficult to think through and to mentally keep a running total of the scores.
Another way of asking this is to use a constant sum approach combined with paired comparisons. In Figure 5.15 the task for respondents has been reduced to making comparisons between 10 pairs of objects. Dealing with pairs is usually easier for respondents to manage.
In this example we have chosen to ask respondents to allocate 11 points between each pair. An odd number has been chosen so that the two objects in any pair cannot be given the same number of points. This forces a distinction between them. This technique can equally well be used for comparing preferences for products, when forcing even small distinctions can be important to the researcher. Had the respondents been asked to allot 10 points per pair, this would have allowed objects in a pair to be given equal weight of five points each.
Both the paired comparison and direct point allocation approaches have difficulties as the number of items increases, either because of the increased mental agility required in the direct approach or because of the increasing number of pairs that are generated.

3. Card sorting
When the number of objects is large, say more than 30, then a different approach is required to obtain a rank ordering or rating of each object. One such approach is card sorting.
In face-to-face interviews each object is described on a card. The card needs to be relatively small but not so small that respondents cannot read it. Larger cards are then laid out, marked as itemized rating scales, for example from ‘Very important’ to ‘Not at all important’. Respondents are then asked to sort the cards into piles according to the rating scale laid out in front of them. Once that task is completed each pile is returned to and the objects in the pile put into rank order.
With electronic self-completion questionnaires, respondents first go through the list of objects, rating them against the itemized rating scale. They are then presented with the objects they have placed in each category in turn and asked to rank-order them.
The data obtained are thus a combination of rating and rank ordering. Complex scoring systems can then be used to provide mean scores for each object. If a five-point rating scale is used, from ‘Very Important’ to ‘Not at all Important’, the scoring structure may be as follows:
Very important – scores between 81 and 100
Quite important – scores between 61 and 80
Neither important nor unimportant – scores between 41 and 60
Not very important – scores between 21 and 40
Not at all important – scores between 1 and 20
The exact score given to each object for each respondent depends on the number of objects that the respondent has placed in the category.
This technique is relatively simple for respondents to cope with, either with face-to-face or Web-based interviewing, and provides a sensitive scoring system for a large number of objects.
4. Q sort
A similar approach designed for larger numbers of attributes is Q sorting. This might be used where there is a very large number of objects, in the region of, say, 100.
The objects are sorted by respondents into a number of categories, usually 11 or 12, representing the degrees on the scale, such as appeal or interest in purchase. Respondents may be instructed to place a specific number of objects on each point of the scale so that they are distributed approximately according to a normal distribution. They are asked to put a few objects at the extremes of the scale, with increasing numbers towards the middle of the scale. Objects placed in the two extreme positions can then be rank-ordered by the respondent for increased discrimination.
Using just five scale points and 10 attributes, Chrzan and Golovashkina (2006) showed that the Q Sort technique produced results that were better than several other techniques in terms of discrimination and prediction, and was quicker to administer than most. However, with a larger number of attributes it may be more difficult to administer and more time consuming than other techniques.
5. Providing examples
It is generally wise to provide an example to show respondents how to complete some of the more complex techniques. Questionnaire writers frequently forget that respondents may not be familiar with these formats, and helping them to understand how to complete a battery of scales can avoid ruined questionnaires or abandoned interviews. It is probably less important to provide examples with electronic questionnaires as they can be programmed to accept responses only in the specified format, one answer to each statement. It is also usually possible and easy for respondents to go back and alter their responses if they realize that they have misunderstood with electronic self-completion questionnaires. It is rather more difficult with paper questionnaires to alter responses without ruining the questionnaire, and it is less likely that respondents would attempt to correct their misunderstanding.
Source: Brace Ian (2018), Questionnaire Design: How to Plan, Structure and Write Survey Material for Effective Market Research, Kogan Page; 4th edition.
20 Aug 2021
20 Aug 2021
23 Oct 2019
20 Aug 2021
20 Aug 2021
20 Aug 2021