In this problem, you will compare the average scores of each HSB student’s father’s and mother’s scores on the same measure, namely, their educational level. Because father’s and mother’s education are not independent of each other, the paired t test is the appropriate test to perform.
The paired samples t test is also used when the two scores are repeated measures, such as the visualization test score and the visualization retest score (see Problem 9.5). Other examples would be in a longitudinal study or in a single group quasi-experimental study in which the same assessment is used as the pretest, before the intervention, and as the posttest, after the intervention.
Assumptions and Conditions for Use of the Paired Samples t test:
- The independent variable is dichotomous and its levels (or groups) are paired, or matched, in some way (e.g., husband-wife, pre-post, etc.).
- The dependent variable is normally distributed in the two conditions.
The first assumption depends on the design; the second can be assessed by examining the skewness of the two variables.
- Do students’ fathers or mothers have more education?
We will determine if the fathers of these students have more education than their mothers. Remember that the fathers and mothers are paired; that is, each child has a pair of parents whose educations are given in the data set. (Note that you can do more than one paired t test at a time, so we could have compared the visualization test and retest scores in the same run as we compared father’s and mother’s education, but we decided to do them separately.)
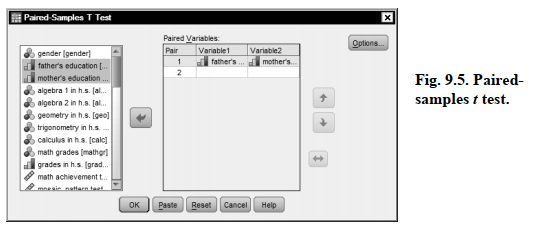
- Select Analyze → Compare Means → Paired Samples T Test
- Move both of the variables, father’s education and mother’s education, to the Paired Variables: box (see Fig. 9.5).
- Click on OK.
Output 9.4: Paired Samples t Tests
T-TEST PAIRS= faed WITH maed (PAIRED)
/CRITERIA=CI(.9500)
/MISSING=ANALYSIS.
T-Test
Interpretation of Output 9.4
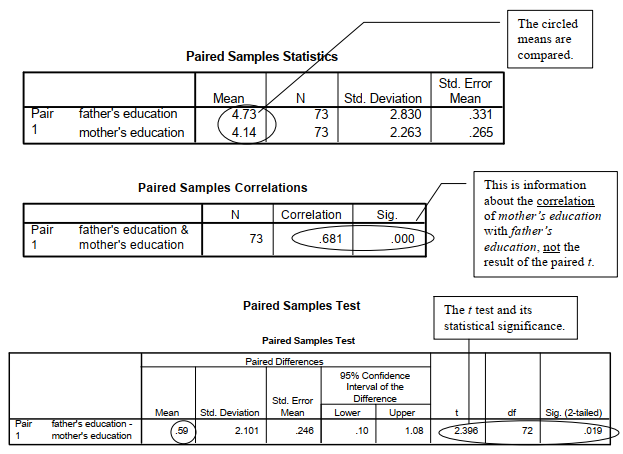
The first table shows the descriptive statistics used to compare mother’s and father’s education levels. The second table, Paired Samples Correlations, provides correlations between the two paired scores. The correlation (r = .68) between mother’s and father’s education indicates that highly educated men tend to marry highly educated women and vice versa. It doesn’t tell you whether men or women have more education. That is what t in the third table tells you.
The last table shows the Paired Samples t Test. The Sig. for the comparison of the average education level of the students’ mothers and fathers was p = .019. Thus, the difference in educational level is statistically significant, and we can tell from the means in the first table that fathers have more education; however, the effect size is small (d = .28) and is computed by dividing the mean of the paired differences (.59) by the standard deviation (2.1) of the paired differences. Also, we can tell from the confidence interval that the difference in the means could be as small as .10 or as large as 1.08 points on the 2 to 10 scale.
It is important that you understand that the correlation in the second table provides you with different information than the paired t. If not, read this interpretation again.
How to Write About Output 9.4
Results
A paired or correlated samples t test indicated that the students’ fathers had on average significantly more education than their mothers, t (72) = 2.40, p = .019, d = .28. The difference, although statistically significant, is small using Cohen’s (1988) guidelines.
Source: Morgan George A, Leech Nancy L., Gloeckner Gene W., Barrett Karen C.
(2012), IBM SPSS for Introductory Statistics: Use and Interpretation, Routledge; 5th edition; download Datasets and Materials.
good post.Never knew this, thankyou for letting me know.