In addition to comparing the means for two paired or matched samples, the paired t can be used in connection with checking reliability, especially test-retest or parallel (equivalent) forms reliability. These reliability measures are usually done using a correlation coefficient, so we could have demonstrated test-retest reliability for the visualization test scores in the last chapter. However, the paired t test program may be a better way to go because it produces and displays not only the reliability correlation but also the comparison of the test and retest means. Thus we can see not only whether the test scores were strongly associated (relatively high test scores have high retests and low tests have low retests) but also whether, on the average, scores on the retest were the same (versus higher or lower) as the test scores. Thus, two alternate forms of a test may provide reliable data for the same construct (high positive correlation), but one form may be easier, such that people generally perform at a higher level on it than on the other form. Or, retesting may lead to higher scores, perhaps due to a practice effect. The paired t program enables one to determine this, providing more information about the tests.
- What is the test-retest reliability of the visualization test scores? Do average visualization retest scores differ from average initial visualization scores?
To compute reliability and mean differences with the paired t test program:
- Select Analyze → Compare Means → Paired Samples T Test…
- Click on Reset.
- Click on both visualization test and visualization retest and move them to the Paired Variables: box (see Fig 9.4 if you need help).
- Click on
Compare your output to Output 9.5.
Output 9.5: Test-Retest Reliability for Visualization Scores
T-TEST PAIRS = visual WITH visual2 (PAIRED)
/CRITERIA = CI(.9500)
/MISSING = ANALYSIS.
Interpretation of Output 9.5
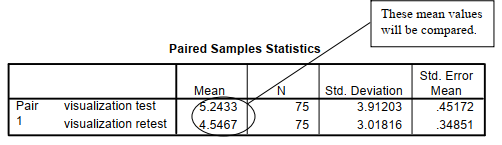
The first table, Paired Samples Statistics, shows the Mean for the visualization test (5.24) and the visualization retest (4.55). These means will be compared in the third table. In addition, the Ns, SDs, and standard errors are shown.
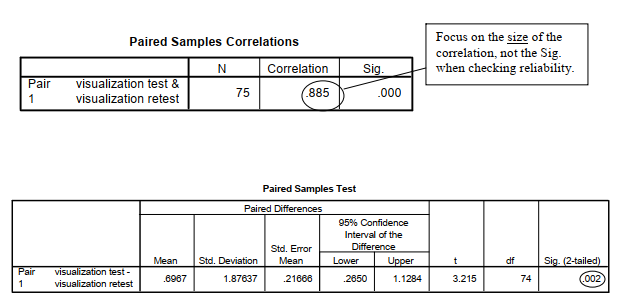
The second table shows the Paired Samples Correlations, which will be used to assess the test- retest reliability of the visualization scores. Note that r = .89, which is a high positive correlation and seems to provide good support for test-retest reliability. This correlation indicates that students who scored high on the test were very likely to score high on the retest, and students who scored low were very likely to score poorly on the retest. More specifically, it indicates that the visualization test is systematically measuring primarily the same thing both times it is taken.
The Paired Samples Test table shows that the means of the test and the retest are significantly different (p = .002). Although the correlation is very high, a significant t test is usually not desirable when the two assessments are supposed to be measuring the same thing. It indicates that, although the same students tended to score high (or low) on the test and the retest, the group average was lower on the retest. For some reason, the retest seemed to be harder. Perhaps the retest was actually an alternate form or version of the test that was supposed to be equivalent but turned out to be more difficult.
Source: Morgan George A, Leech Nancy L., Gloeckner Gene W., Barrett Karen C.
(2012), IBM SPSS for Introductory Statistics: Use and Interpretation, Routledge; 5th edition; download Datasets and Materials.
15 Sep 2022
29 Mar 2023
28 Mar 2023
31 Mar 2023
31 Mar 2023
27 Mar 2023