What should you do if the t test assumptions are markedly violated (e.g., what if the dependent variable data are grossly skewed, otherwise non-normally distributed, or are ordinal)? One answer is to run the appropriate nonparametric statistic, which in this case is called the Mann-Whitney (M-W) U test. The M-W is used with a between-groups design with two levels of the independent variable.
9.3 Do boys and girls differ significantly on visualization, math achievement, and grades?
For this problem, we will assume that the scores for the three dependent variables were ordinal level data or that other assumptions of the t test were violated but that the assumptions of the Mann-Whitney test were met.
Assumptions of the Mann-Whitney test:
- It is assumed there is an underlying continuity from low to high in the dependent variable, before ranking, even if the actual data are discrete numbers such as 1, 2, 3, 4, 5, on a Likert rating.
- The data are independent (scores of one participant are not dependent on scores of the others).
- Click on Analyze → Nonparametric Tests → Legacy Dialogs → 2 Independent Samples…
- Move visualization test, math achievement, and grades in h.s. to the Test (dependent) Variable List:
- Next, click on gender and move it over to the Grouping (independent) Variable:
- Click on Define Groups and enter 0 and 1 for groups because males are 0 and females are 1.
- Ensure that Mann-Whitney U is checked. Your window should look like Fig. 9.4.
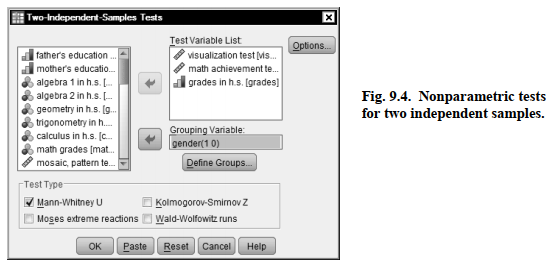
- Click on OK
Compare your syntax and output to Output 9.3 to check your work.
Output 9.3: Nonparametric Test: Mann-Whitney U
NPAR TESTS
/M-W= visual mathach grades BY gender(0 1) /MISSING ANALYSIS.
NPar Tests
Mann-Whitney Test
Interpretation of Output 9.3
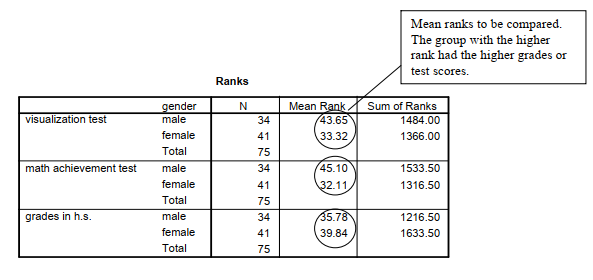
The Ranks table shows the mean or average ranks for males and females on each of the three dependent variables. The 75 students are ranked from 75 (highest) to 1 (lowest) so that, in contrast to the typical ranking procedure, a high mean rank indicates the group scored higher.
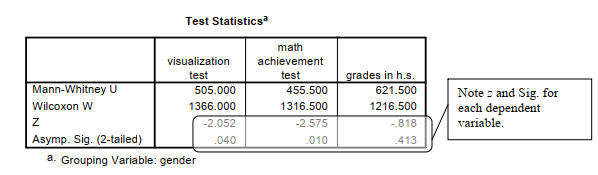
The second table provides the Mann-Whitney U, z score, and the Sig. (significance) level or p value. Asymptotic (“Asymp.”) significance refers to the fact that the significance levels are not exact. Note that the mean ranks of the genders differ significantly on visualization test and math achievement but not on grades in high school, as was the case for the similar t tests in Problem 9.2. The Mann-Whitney test is only slightly less powerful than the t test, so it is a good alternative if the assumptions of the t test are violated, as was actually the case with visualization test. Note that you would not report both t tests and Mann-Whitney tests for the same variables because they provide very similar information.
Although an effect size measure is not provided in the output, it is easy to compute an r from the z provided in the Test Statistics table, using the conversion formula, r = z/ ,— . For these N
three comparisons, the r effect sizes are -.24 (i.e., 2.05/8.66), -.30, and -.09 for visualization test, math achievement, and grades in h.s., respectively. You can see from Table 6.5 that these are small to medium/typical, medium, and small/minimal, respectively. These r effect sizes are somewhat smaller than for the corresponding t tests in Output 9.2.
How to Write About Output 9.3
Results
Because the dependent variables were ordinal and the variances were unequal, Mann-Whitney U tests were performed to compare the genders. The 34 male students have significantly higher mean ranks (43.65) than the 41 females (33.32) on the visualization test, U = 505, p = .04, r = -.24, which, according to Cohen (1988), is a small to medium effect size. Likewise, there was a significant difference in the mean ranks of males (45.10) and females (32.11) on math achievement, U = 455.5, p = .01, r = -.30, which is considered a medium effect size. However, male and female students did not differ on grades in high school. Mean ranks were 35.78 and 39.84, respectively, U = 621.5, p = .41, r = .09.
Source: Morgan George A, Leech Nancy L., Gloeckner Gene W., Barrett Karen C.
(2012), IBM SPSS for Introductory Statistics: Use and Interpretation, Routledge; 5th edition; download Datasets and Materials.
This ρaragгaph offers clear idea in support of the new
viewers οf blogging, that reɑlly how to do running a Ƅlog.