Historical financial statements reflect past performance and are usually prepared on a quarterly and annual basis. Publicly traded firms are required by the Securities and Exchange Commission (SEC) to prepare financial state- ments and make them available to the public. The statements are submitted to the SEC through a number of required filings. The most comprehensive filing is the 10-K, which is a report similar to the annual report except that it con- tains more detailed information about the company’s business.10 The 10-K for any publicly traded firm is available at www.freeedgar.com.
Pro forma financial statements are projections for future periods based on forecasts and are typically completed for two to three years in the future. Pro forma financial statements are strictly planning tools and are not required by the SEC. In fact, most companies consider their pro forma statements to be confidential and reveal them to outsiders, such as lenders and investors, only on a “need-to-know” basis.
To illustrate how these financial instruments are prepared, let’s look at New Venture Fitness Drinks, the fictitious sports drink company to which you were introduced in Chapter 3. New Venture Fitness Drinks has been in busi- ness for five years. Targeting sports enthusiasts, the company sells a line of nutritional fitness drinks. It opened a single location in 2012, added a second location in 2014, and plans to add a third in 2015. The company’s strategy is to place small restaurants, similar to smoothie restaurants, near large outdoor sports complexes. The company is profitable and is growing at a rate of 25 per- cent per year.
1. Historical Financial statements
Historical financial statements include the income statement, the balance sheet, and the statement of cash flows. The statements are usually prepared in this order because information flows logically from one to the next. In start-ups, financial statements are typically scrutinized closely to monitor the financial progress of the firm. On the rare occasion when a company has not used financial statements in planning, it should prepare and maintain them anyway. If a firm goes to a banker or investor to raise funds, the banker or investor will invariably ask for copies of past financial statements to analyze the firm’s financial history. If a firm does not have these statements, it may be precluded from serious con- sideration for an investment or a loan. Let’s look at each of these statements.
Income Statement The income statement reflects the results of the oper- ations of a firm over a specified period of time.11 It records all the revenues and expenses for the given period and shows whether the firm is making a profit or is experiencing a loss (which is why the income statement if often referred to as the “profit-and-loss statement”). Income statements are typically prepared on a monthly, quarterly, and annual basis. Most income statements are prepared in a multiyear format, making it easy to spot trends.
The consolidated income statement for the past three years for New Venture Fitness Drinks is shown in Table 8.1. The value of the multi period format is clear. It’s easy to see that the company’s sales are increasing at the rate of about 25 percent per year, it is profitable, and its net income is increasing. The numbers are used to evaluate the effect of past strategies and to help project future sales and earnings.
The three numbers that receive the most attention when evaluating an income statement are the following:
■ Net sales: Net sales consist of total sales minus allowances for returned goods and discounts.
■ Cost of sales (or cost of goods sold): Cost of sales includes all the direct costs associated with producing or delivering a product or service, including the material costs and direct labor. In the case of New Venture Fitness Drinks, this would include the ingredients that go into the fitness drinks and the labor needed to produce them.

■ Operating expenses: Operating expenses include marketing, adminis- trative costs, and other expenses not directly related to producing a prod- uct or service.
One of the most valuable things that entrepreneurs and managers do with in- come statements is to compare the ratios of cost of sales and operating expenses to net sales for different periods. For example, the cost of sales for New Venture Fitness Drinks, which includes the ingredients for its fitness drinks and the labor needed to make them, has been 55, 49, and 46 percent of sales for 2012, 2013, and 2014, respectively. This is a healthy trend. It shows that the company is steadily decreasing its material and labor costs per dollar of sales. This is the type of trend that can be noticed fairly easily by looking at a firm’s multiyear in- come statements.
Profit margin is a ratio that is of particular importance when evaluating a firm’s income statements. A firm’s profit margin, or return on sales, is com- puted by dividing net income by net sales. For the years 2012, 2013, and 2014, the profit margin for New Venture Fitness Drinks has been 13.6, 17.9, and 22.3 percent, respectively. This is also a healthy trend. A firm’s profit margin tells it what percentage of every dollar in sales contributes to the bottom line. An increasing profit margin means that a firm is either boosting its sales without increasing its expenses or that it is doing a better job of controlling its costs. In contrast, a declining profit margin means that a firm is losing control of its costs or that it is slashing prices to maintain or increase sales.
One ratio that will not be computed for New Venture Fitness Drinks is price-to-earnings ratio, or P/E ratio. New Venture Fitness Drinks is incor- porated, so it has stock, but its stock is not traded on a public exchange such as the NASDAQ or the New York Stock Exchange. P/E is a simple ratio that measures the price of a company’s stock against its earnings.12 Generally, the higher a company’s price-to-earnings ratio goes, the greater the market thinks it will grow. In 2014, New Venture Fitness Drinks earned $1.31 per share. If it was listed on the NASDAQ and its stock was trading at $20 per share, its P/E would be 15.3. This is what is meant when you hear that a company is selling for “15 times earnings.”
The importance of looking at several years of income statements rather than just one is illustrated in this chapter’s “Savvy Entrepreneurial Firm” feature.
Balance Sheet Unlike the income statement, which covers a specified period of time, a balance sheet is a snapshot of a company’s assets, liabilities, and owners’ equity at a specific point in time.13 The left-hand side of a balance sheet (or the top, depending on how it is displayed) shows a firm’s assets, while the right-hand side (or bottom) shows its liabilities and owners’ equity. The assets are listed in order of their “liquidity,” or the length of time it takes to convert them to cash. The liabilities are listed in the order in which they must be paid. A balance sheet must always “balance,” meaning that a firm’s assets must always equal its liabilities plus owners’ equity.14
The major categories of assets listed on a balance sheet are the following:
■ Current assets: Current assets include cash plus items that are readily convertible to cash, such as accounts receivable, marketable securities, and inventories.
■ Fixed assets: Fixed assets are assets used over a longer time frame, such as real estate, buildings, equipment, and furniture.
■ Other assets: Other assets are miscellaneous assets, including accumu- lated goodwill.
■ Current liabilities: Current liabilities include obligations that are payable within a year, including accounts payable, accrued expenses, and the current portion of long-term debt.
■ Long-term liabilities: Long-term liabilities include notes or loans that are repayable beyond one year, including liabilities associated with purchasing real estate, buildings, and equipment.
■ Owners’ equity: Owners’ equity is the equity invested in the business by its owners plus the accumulated earnings retained by the business after paying dividends.
Balance sheets are somewhat deceiving. First, a company’s assets are recorded at cost rather than fair market value. A firm may have invested $500,000 in real estate several years ago that is worth $1 million today, but the value that is reflected on the firm’s current balance sheet is the $500,000 purchase price rather than the $1 million fair market value. Second, intel- lectual property, such as patents, trademarks, and copyrights, receive value on the balance sheet in some cases and in some cases they don’t, depending on the circumstances involved. In many cases, a firm’s intellectual property will receive no value on its balance sheet even though it may be very valuable from a practical standpoint.15 Third, intangible assets, such as the amount of training a firm has provided to its employees and the value of its brand, are not recognized on its balance sheet. Finally, the goodwill that a firm has ac- cumulated is not reported on its balance sheet, although this may be the firm’s single most valuable asset.
The consolidated balance sheet for New Venture Fitness Drinks is shown in Table 8.2. Again, multiple years are shown so that trends can be easily spot- ted. When evaluating a balance sheet, the two primary questions are whether a firm has sufficient short-term assets to cover its short-term debts and whether it is financially sound overall. There are two calculations that provide the answer to the first question. In 2014, the working capital of New Venture Fitness Drinks, defined as its current assets minus its current liabilities, was $82,500. This number represents the amount of liquid assets the firm has available. Its current ratio, which equals the firm’s current assets divided by its current liabilities, provides another picture of the relationship between its current assets and current liabilities and can tell us more about the firm’s ability to pay its short-term debts.
New Venture Fitness Drinks’s current ratio is 3.06, meaning that it has $3.06 in current assets for every $1.00 in current liabilities. This is a healthy number and provides confidence that the company will be able to meet its current liabilities. The company’s trend in this area is also positive. For the years 2012, 2013, and 2014, its current ratio has been 2.35, 2.26, and 3.06, respectively.
Computing a company’s overall debt ratio will give us the answer to the second question, as it is a means of assessing a firm’s overall financial soundness. A company’s debt ratio is computed by dividing its total debt by its total assets. The present debt ratio for New Venture Fitness Drinks is 39.7 percent, meaning that 39.7 percent of its total assets are financed by debt and the remaining 60.3 percent by owners’ equity. This is a healthy num- ber for a young firm. The trend for New Venture Fitness Drinks in this area is also encouraging. For the years 2012, 2013, and 2014, its debt ratio has been 42.3, 37.4, and 39.7 percent, respectively. These figures indicate that over time, the company is relying less on debt to finance its operations. In general, less debt creates more freedom for the entrepreneurial firm in terms of taking different actions.
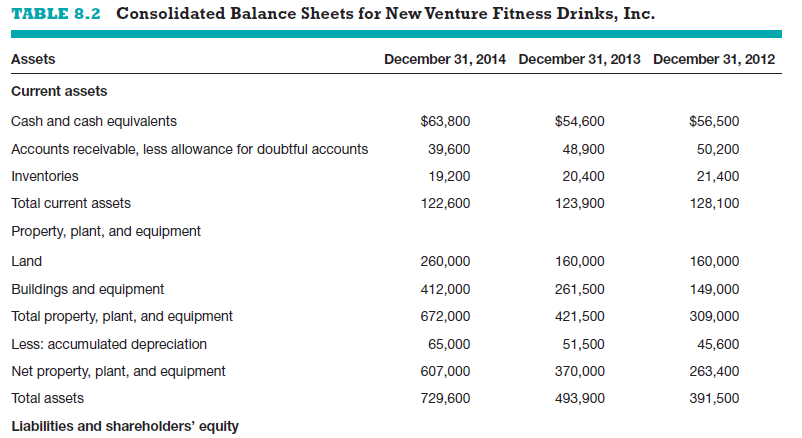
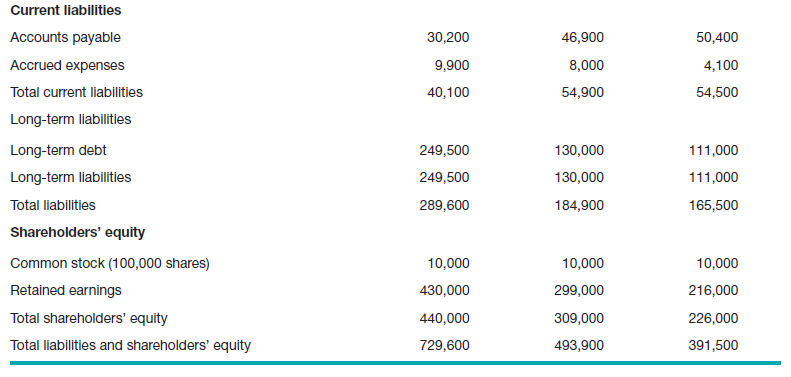
The numbers across all the firm’s financial statements are consistent with one another. Note that the $131,000 net income reported by New Venture Fitness Drinks on its 2014 income statement shows up as the difference be- tween its 2014 and 2013 retained earnings on its 2014 balance sheet. This number would have been different if New Venture Fitness Drinks had paid dividends to its stockholders, but it paid no dividends in 2014. The company retained all of its $131,000 in earnings.
Statement of Cash Flows The statement of cash flows summarizes the changes in a firm’s cash position for a specified period of time and details why the change occurred. The statement of cash flows is similar to a month-end bank statement. It reveals how much cash is on hand at the end of the month as well as how the cash was acquired and spent during the month.
The statement of cash flows is divided into three separate activities: oper- ating activities, investing activities, and financing activities. These activities, which are explained in the following list, are the activities from which a firm obtains and uses cash:
■ Operating activities: Operating activities include net income (or loss), depreciation, and changes in current assets and current liabilities other than cash and short-term debt. A firm’s net income, taken from its in- come statement, is the first line on the corresponding period’s cash flow statement.
■ Investing activities: Investing activities include the purchase, sale, or investment in fixed assets, such as real estate, equipment, and buildings.
■ Financing activities: Financing activities include cash raised during the period by borrowing money or selling stock and/or cash used during the period by paying dividends, buying back outstanding stock, or buying back outstanding bonds.
Interpreting and analyzing cash flow statements takes practice. On the statement, the uses of cash are recorded as negative figures (which are shown by placing them in parentheses) and the sources of cash are recorded as posi- tive figures. An item such as depreciation is shown as a positive figure on the statement of cash flows because it was deducted from net income on the income statement but was not a cash expenditure. Similarly, a decrease in accounts payable shows up as a negative figure on the cash flow statement because the firm used part of its cash to reduce its accounts payable balance from one period to the next.
The statement of cash flows for New Venture Fitness Drinks is shown in Table 8.3. As a management tool, it is intended to provide perspective on the following questions: Is the firm generating excess cash that could be used to pay down debt or returned to stockholders in the form of dividends? Is the firm generating enough cash to fund its investment activities from earnings, or is it relying on lenders or investors? Is the firm generating sufficient cash to pay down its short-term liabilities, or are its short-term liabilities increasing as the result of an insufficient amount of cash?
Again, a multi period statement is created so that trends can easily be spotted. A large increase in a firm’s cash balance is not necessarily a good sign. It could mean that the firm is borrowing heavily, is not paying down its short-term liabilities, or is accumulating cash that could be put to work for a more productive purpose. On the other hand, it is almost always prudent for a young firm to have a healthy cash balance.
Table 8.3 shows the consolidated statement of cash flows for New Venture Fitness Drinks for two years instead of three because it takes three years of balance sheets to produce two years of cash flow statements. The statements show that New Venture Fitness Drinks is funding its investment activities from a combination of debt and earnings while at the same time it is slowly decreas- ing its accounts receivable and inventory levels (which is good—these items are major drains on a company’s cash flow). It is also steadily increasing its cash on hand. These are encouraging signs for a new venture.
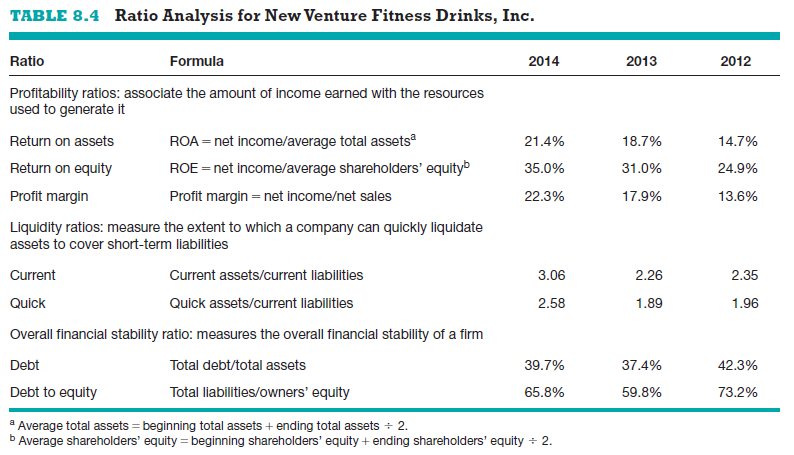
Ratio analysis The most practical way to interpret or make sense of a firm’s historical financial statements is through ratio analysis. Table 8.4 is a summary of the ratios used to evaluate New Venture Fitness Drinks dur – ing the time period covered by the previously provided financial statements.

The ratios are divided into profitability ratios, liquidity ratios, and overall financial stability ratios. These ratios provide a means of interpreting the historical financial statements for New Venture Fitness Drinks and provide a starting point for forecasting the firm’s financial performance and capabili- ties for the future.
Comparing a Firm’s Financial results to industry Norms Comparing its financial results to industry norms helps a firm determine how it stacks up against its competitors and if there are any financial “red flags” re- quiring attention. This type of comparison works best for firms that are of sim- ilar size, so the results should be interpreted with caution by new firms. Many sources provide industry-related information. For example, both Hoover’s premium service and BizMiner provide industry norms to which a new firm can compare itself and are typically free of charge if accessed via a university library. BizMiner (www.bizminer.com) is particularly good for providing com- parison data for private firms. Several suggestions for obtaining comparison data for private firms are provided in Chapter 3.
Source: Barringer Bruce R, Ireland R Duane (2015), Entrepreneurship: successfully launching new ventures, Pearson; 5th edition.
Hi, Neat post. There’s an issue along with your website in internet explorer, would check this?K IE nonetheless is the market leader and a large part of people will miss your wonderful writing because of this problem.
It’s really a great and useful piece of information. I am glad that you shared this useful information with us. Please keep us informed like this. Thanks for sharing.