The Graph Editor allows us to alter the appearance of a graph currently in memory, whether just drawn or previously saved and retrieved by graph use. It is easier to learn about this useful feature by experimenting yourself, rather than reading from a book. As an example to get started, however, we can show how to make a few changes in Figure 3.18. A first step is to retrieve this graph into memory.
. graph use C:\graphs\fig03_18.gph
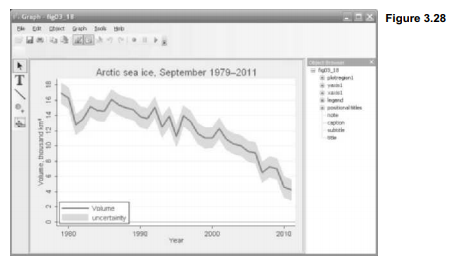
Then, in the Graph window, select File > Start Graph Editor, or click the Graph Editor icon . The view will change to include a Tools Toolbar on the left margin and an Object Browser on the right, as seen in Figure 3.28. The Tools Toolbar contains a pointer tool for selecting parts of the graph, and other tools to add text, add lines, add markers, and edit the graph grid. The Object Browser presents a hierarchical list of graph contents. Some items are marked with a + sign, and clicking on this + will expand the list to show lower objects within it. We can select objects in the graph by clicking the pointer on their image, or by clicking names in the Object Browser (often easier in complex graphs).
“Plot1” in this image refers to the twoway rarea plot forming the gray error bands. Click on the gray band (or plot1 under plotregion1 at right) to select them. Plot1 is now highlighted both in the Object Browser, and in the graph itself. Selecting an object opens a Contextual Toolbar just above the graph, which gives information about the properties of that object. In this instance we see that plot1 is a range-area or rarea plot, with color Gray 13, intensity 80% and outline width Medium. If we click More… on the Contextual Toolbar we would see further options to control the properties of the selected object.

Changing the plottype from Rarea (range area) to Reap (range capped), color from Gray 13 to Gray 3 (darker), and outline width from Medium to Medium thick gives the graph a new look (Figure 3.30).
Plot2 in this image refers to the twoway line plot that was overlaid to form the main line in Figure 3.18. If we select plot2 in the Graph Editor, then change its plottype from Line to Scatter, and its color to Gray 5, we get something like Figure 3.29. This final image also includes an arrow with the text “2010 significantly lower,” added using the T (text) and line tools from the left-margin toolbar.

In general, the Graph Editor revises graph features in ways that could have been controlled by the original graph command. We cannot do things such as move an individual data point in the plot, although we can add or move new markers at any position. On the other hand, it is easy to change the properties of markers, lines, axis labels or titles. We can also hide objects, making them invisible. Any changes made in the Graph Editor become permanent when we save the graph.
Source: Hamilton Lawrence C. (2012), Statistics with STATA: Version 12, Cengage Learning; 8th edition.
3 Oct 2022
30 Sep 2022
30 Sep 2022
3 Oct 2022
1 Oct 2022
28 Sep 2022