As more of the market players want to buy stocks and fewer want to sell their stock holdings, stock prices will be driven up. Likewise, if many market players want to sell their stocks relative to the number of participants who want to buy stocks, stock prices will fall. Looking at the increase or decrease in the price of one stock will tell us how strong the market for that one particular stock is. If we want to measure the overall direction of the stock market, however, we need a way of measuring the movement of the broad market that is composed of the stocks of many companies.
Although the origins of the U.S. stock market date back to 1792 when 24 New York City stockbrokers and merchants gathered under a buttonwood tree and signed the Buttonwood Agreement, it was almost 100 years later before the concept of a measure of overall market movement was developed. At the end of the nineteenth century, Charles H. Dow began publishing a representative average of stocks. Dow intended to gauge overall market trends by looking at the combined stock price movement of nine railroad stocks, the blue chips of the day. As we discussed in Chapter 3, “History of Technical Analysis,” Dow’s initial average developed into the Dow Jones Industrial Average that we have today. Dow’s work also led to the development of the Dow J ones T ransportation Average and the Dow J ones Utility Average.
Building on Dow’s initial concept, other individuals have also developed averages, or indices, to measure market movement. Today there are almost as many averages or indices as there are stocks. Although the concept of a market average or index might be simple, choosing a method to use to construct the index is complicated. There are three major types of index construction: price weighted, market capitalization weighted, and equally weighted.
1. Price-Weighted Average
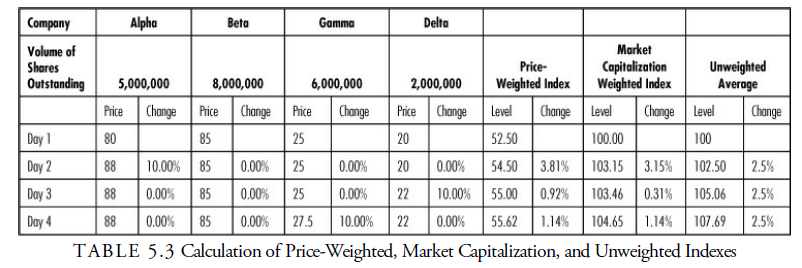
The Dow Jones averages are price-weighted averages. This means that the prices for each of the component stocks are added together, and the sum is divided by a divisor that has changed over the years to account for splits and stock dividends in each of the component stocks. To see how a price-weighted average is constructed, consider the four hypothetical stocks in Table 5.3. A price-weighted average for each trading day is calculated by simply adding the four prices and dividing by four. The problem with a price-weighted average is that a high-priced stock will have more influence on the average than a lower-priced stock. Note that between trading Day 1 and Day 2, the price of Alpha increased by 10%, while the price of the other three stocks remained constant; this led to a 3.8% increase in the value of the price-weighted index. On the following trading day, the price of Delta rose by 10% and the price of the other three stocks did not change. When the lower-priced Delta increased in value by 10%, the price-weighted index only changed by 0.9%. The price-weighted average does not represent the usual manner in which a portfolio is constructed. Investors rarely invest in an equal number of shares in each portfolio stock.
2. Market Capitalization Weighted Average
Another way to calculate a market index is to use market capitalization in the weighting scheme. The Standard & Poor’s 500 Index is a market capitalization weighted index, in which each of the 500 stocks is weighted by its market value. The NYSE composite index, the Nasdaq composite index, and the Russell Indexes are also capitalization weighted. An interesting change in the Standard & Poor’s 500 Index began in the spring of 2005. Rather than calculating the index based on the shares outstanding in each company, Standard & Poor’s index now calculates based on the float of each stock. F loat is a term used to describe the number of shares actually available to the marketplace for purchase or sale. In many companies, some stock is held in the treasury, some has been given to employees in the form of options, some has been reissued in secondary offerings, and some is held closely by entities such as pension funds, foundations, other companies, owners, or syndicates. These closely held shares are generally not available for normal day-to-day transactions and are, thus, eliminated from the calculation of the index. The purpose in this new calculation is to reduce the influence on the index by the amount of capital value that is locked up and not available to the market.
To compare the way this index construction differs from price weighting, refer to Table 5.3. To begin creating a market capitalization weighted index, an initial market value of all the included stocks is calculated. In our example, this would be accomplished by multiplying each stock’s price by the number of shares outstanding on Day 1. This gives a value of 1,270,000,000. This initial figure is the base and is assigned an index value, usually of 100. Then a new market value is calculated for all of the securities each trading day. This new value is compared with the initial base level to calculate a daily index value. The general formula for calculating the daily index level is
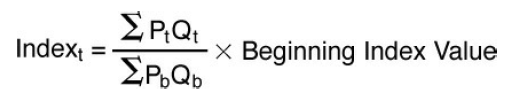
Because of the weighting scheme used, stocks with a large number of shares outstanding and high prices have a disproportionate influence on a market capitalization weighted index. In the Table 5.3 sample data, one stock increased in value by 10% while all the other stocks remained the same on Days 2, 3, and 4. Look at how much more sensitive the index was to changes when the stock had a relatively high price or number of shares outstanding. Just as the price-weighted index is not representative of the way most investors purchase stocks, neither is the market capitalization weighted index. An investor seldom invests in stocks in proportion to their market capitalization.
3. Equally Weighted (or Geometric) Average
A third method of calculating an index uses equal weighting of all included stocks. Sometimes, the term unweighted index is used to refer to this type of average because all stocks carry equal weight, regardless of their price or market value. This index is calculated by averaging the percentage price changes of each of the stocks included in the group. As you can see in Table 5.3, it does not matter which stock increases by a particular percent. For each of the sample trading days, one stock increased in value by 10% while the other three stocks remained unchanged; each day, the equally weighted average index increased by 2.5%.
This index calculation is a dollar-weighted average; in other words, it assumes that an investor invests equal dollar amounts in each stock. For example, an investor with $10,000 would purchase $2,500 worth of each of the four stocks in our example. Thus, the investor would be purchasing fewer shares of the high price per share stocks and more shares of the low price per share stocks. This calculation most closely represents the way the typical investor goes about organizing a portfolio.
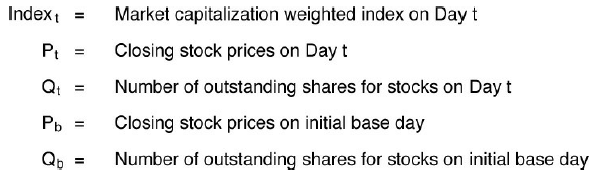
Several of the Value Line averages are equal weighted averages that are calculated using an arithmetic average of the percent changes. However, one of the Value Line averages, the Value Line Industrials Average, and the Financial Times Ordinary Share Index are equally weighted averages that are constructed in a slightly different manner. These two indices are computed using a geometric average of the holding period returns. Table 5.4 demonstrates the calculation of a geometric average for the four-stock portfolio example.
Comparing this geometric average with the equally weighted average calculated for the same stocks shows a downward bias when using a geometric average rather than an arithmetic average. An investor who had purchased $100 of each of these four stocks on Day 1 and held each of these stocks for all four days would have an ending wealth of $430, or 7.5% greater than the beginning wealth level of $400. The geometric weighted index shows a change of 7.41%.
Source: Kirkpatrick II Charles D., Dahlquist Julie R. (2015), Technical Analysis: The Complete Resource for Financial Market Technicians, FT Press; 3rd edition.
It’s arduous to find knowledgeable people on this subject, but you sound like you understand what you’re speaking about! Thanks
Just wanna comment that you have a very nice internet site, I love the style it actually stands out.