Maximum-likelihood factoring, unlike Stata’s other factor options, provides formal hypothesis tests that help in determining the appropriate number of factors. To obtain a single maximum- likelihood factor for the planetary data, type


The ml output includes two likelihood-ratio % 2 tests:
LR test: independent vs. saturated
This tests whether a no-factor (independent) model fits the observed correlation matrix significantly worse than a saturated or perfect-fit model. A low probability (here 0.0000, meaningp < .00005) indicates that a no-factor model is too simple.
LR test: 1 factor vs. saturated
This tests whether the current 1-factor model fits significantly worse than a saturated model. The low p-value here suggests that one factor is too simple, as well.
Perhaps a 2-factor model will do better:
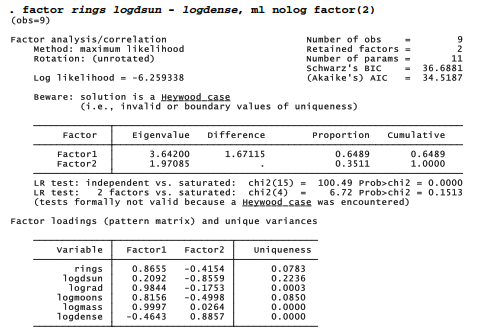
Now we find the following:
LR test: independent vs. saturated
The first test is unchanged; a no-factor model is too simple.
LR test: 2 factors vs. saturated
The 2-factor model is not significantly worse (p = .1513) than a perfect-fit model. These tests suggest that two factors provide an adequate model.
Computational routines performing maximum-likelihood factor analysis often yield Heywood solutions, or unrealistic results such as negative variance or zero uniqueness. When this happens (as in the 2-factor ml example above), the %2 tests lack formal justification. Viewed descriptively, the tests can still provide informal guidance regarding the appropriate number of factors.
Source: Hamilton Lawrence C. (2012), Statistics with STATA: Version 12, Cengage Learning; 8th edition.
3 Oct 2022
28 Sep 2022
3 Oct 2022
24 Sep 2022
24 Sep 2022
26 Sep 2022