Instead of creating a new variable where you are subtracting the variable’s mean, SPSS gives you another option to center the data by “standardizing” the indicators (or converting it to a Z score). With mean centering, you are changing the mean value, but the standard deviation and scale remain the same.This is not the case with Z scores. If you convert your data to a Z score, SPSS will rescale the data so that one unit in the data is equivalent to one standard deviation. Both methods will center the mean to zero, but using Z scores will also completely rescale the data.
To create a Z score with your data, you need to go to the “Analyze” menu option in SPSS, then select “Descriptive Statistics” and then choose “Descriptives”. A pop-up window will appear where you will include the variables of the moderator and the independent variable in the “Variables” option.You will also see at the bottom of the pop-up window a checkbox that states “Save Standardized Values as Variables”. Check this box and hit OK.

Figure 7.28 Creating Z Scores of Variables in SPSS
SPSS will create a new variable for each one of the variables selected in the Descriptives window. At the end of the data, SPSS will add a “Z” in the front of the newly formed variable along with the original variable name. See Figure 7.29.

Figure 7.29 Example of Variables Transformed Into Z Scores in SPSS
These standardized variables are now mean centered and rescaled.You will then use these Z score indicators to create interaction terms just like we did with the mean centered example. I have included an example of what the graphic depiction would look like in AMOS. Notice that the interaction terms are all reformed with the Z scores and all the labels have a Z at the front to denote a Z score interaction.
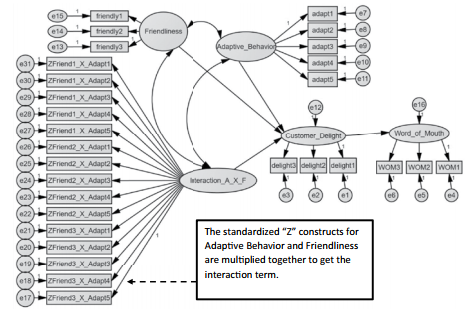
Figure 7.30 Example of Z Scores Used in Moderation Testing
Let’s now look at the results of our full structural moderation test with the standardized Z score interactions and compare the results to the mean centered moderation test.

Figure 7.31 Comparison of Mean Centered and Z Score Results
Comparison of the results shows a small difference in the unstandardized regression weights of the interaction variable.The t-value for the interaction is exactly the same across the differ- ent tests. The standardized regression weights are also exactly the same across the two tests. Any differences that are present across the two moderation tests is a result of rescaling the data with the Z scores and rounding considerations with the mean centered option.The results are essentially equivalent.
Probing the interaction with a Z score moderation test is accomplished in a slightly different manner. Transforming the data to a Z score rescales the data where 1 unit (or a value of 1) is 1 standard deviation. To create the high moderation variable, you would need to take the Z score for each indicator of the moderator and subtract a value of 1. For the low moderation, you would add a value of 1 to all the Z scores for the indica- tors of the moderator. After that, you would form your interaction terms with the Z score Hi/Low moderator indicators multiplied by the independent variables’ Z score indicators.
Whether you use mean centering or Z scores, both methods should help to account for any potential multicollinearity between the moderator and the independent variable.While the Z score option may save you some time, you need to be aware that Z scores will rescale your data and subsequently impact standard deviation values.With a mean centered value, your standard deviation does not change from the original data, and the scale is still the same. One unit with a mean centered value is still one unit.
Source: Thakkar, J.J. (2020). “Procedural Steps in Structural Equation Modelling”. In: Structural Equation Modelling. Studies in Systems, Decision and Control, vol 285. Springer, Singapore.
29 Mar 2023
31 Mar 2023
29 Mar 2023
30 Mar 2023
30 Mar 2023
29 Mar 2023