The first step before analyzing your SEM model is to examine your data to make sure there are no errors, outliers, or respondent misconduct. We also need to assess if you have any missing data. Once your data has been keyed into a data software program like Excel, SAS, or SPSS, the first thing you need to do is set up an “ID” column. I usually do this on the first column of the data, and it is simply an increasing number from 1 (on the first row) to the last row of the data. This is done to make it easier to find a specific case, especially if you have sorted on different col- umns.After forming an ID column, it is a good idea to initially examine if you have any respond- ent abandonment or misconduct.The quickest and easiest way to see if respondent abandonment has occurred is simply to sort the last few columns of the data in an ascending order. Hence, you can see if the respondent dropped out of the survey and stopped answering questions. These incomplete rows are then subject to deletion. If a respondent failed to answer the last few ques- tions, you need to determine if this amount of missing data is sufficiently acceptable to retain the respondent’s other answers. If the respondent has an excessive amount of missing data, then you are better off just deleting that respondent from the overall data. Later in this chapter, I will discuss how much missing data is acceptable in order to proceed with an analysis.
After making a determination if respondents who failed to complete the survey should be deleted, the next thing you need to assess is respondent misconduct. Let’s say you have a survey asking Likert scale questions (1 to 7 scale).You want to assess if a respondent simply marked the same answer for every question. The likelihood that the respondent feels the exact same way for every question is small and is subject to deletion because of respondent misconduct. Sometimes you will also hear this called “yea-saying”, where the respondent is not reading the questions and just marks agreement at the same level for the rest of the survey. An additional step you can take to assess if respondent misconduct is taking place is to add attention check measures to your survey. These questions are added simply to make sure the respondent is paying attention to the questions, and they may ask the respondent to specifically select a number on the 1 to 7 scale.
To see if you have a problem in your data set, examining the standard deviation of answers for each specific respondent is a good way to assess if respondent misconduct is present.While SPSS is great at analyzing data, accomplishing this task in SPSS is quite laborious. If your data is in SPSS, a better (and quicker) option is to use Microsoft Excel; you copy the “ID” column and the Likert scale indicator questions from SPSS and paste this data into Excel. Go to the last column that is blank and simply input the standard deviation function =STDEV.P(selected columns) and highlight “only” the Likert Scale items in the row (do not include the ID column). This will allow you to see the standard deviation for each row (respondent). Anything with a standard deviation that is less than .25 is subject to deletion because there is little to no variance among the responses across the survey. Saying that, it does not mean that if a standard devia- tion is under .25, you need to automatically delete the record. As the researcher, you need to determine what is an acceptable level of agreement (or disagreement) within the questions, and this can be a matter of how large or small the survey is as well.You may have an extremely hard to get sample with a short survey, and in that instance, you might want to lower the value before deleting records.There are no golden rules that apply to every situation, but if you have a standard deviation of a respondent that is under .25, then you need to strongly consider if this respondent’s answers are valid moving forward. See Figure 2.1 for assessing the standard deviation of a respondent’s answers in Excel.
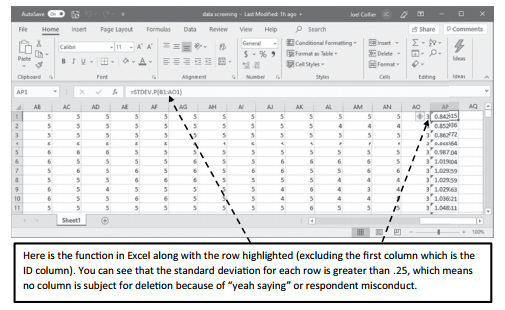
Figure 2.1 Data Screening Standard Deviation of Respondent’s Answers
Another type of respondent misconduct is the time/duration the respondent takes to complete the survey. Many online surveys will tell you the start time and stop time of each respondent. An extremely short period of time may be indictive of respondent misconduct. If you have a 50-question survey and it takes a respondent only 57 seconds to take the full survey, then most likely that respondent is not reading the questions and is not answering in a valid manner.This type of respondent misconduct needs to be considered for deletion as well.
After assessing if there is a problem with a particular respondent, it is a good idea to screen your indicators for issues. For instance, let’s say I am asking customers if they were delighted about a restaurant experience and, specifically, if the restaurant server produced these feelings of delight. To capture customers’ perceptions of delight, I will ask customers three separate survey questions. The questions are asked on a 7-point scale, and I want to make sure that no answers are outside of the 7-point scale range. The first step in data screening of an indicator is to see if you have any impermissible values.
Source: Thakkar, J.J. (2020). “Procedural Steps in Structural Equation Modelling”. In: Structural Equation Modelling. Studies in Systems, Decision and Control, vol 285. Springer, Singapore.
30 Mar 2023
28 Mar 2023
28 Mar 2023
29 Mar 2023
27 Mar 2023
30 Mar 2023