In the late 1950s, the Program Evaluation and Review Technique (PERT) and the Critical Path Method (CPM) were independently developed. PERT was developed by the U.S. Navy, Booz-Allen Hamilton (a business consulting firm), and Lockheed Aircraft (now Lockheed Martin Corp.); and CPM was developed by Dupont De Nemours Inc. When they were developed, there were significant differences in the methods. For example, PERT used probabilistic (or uncertain) estimates of activity durations and CPM used deterministic (or certain) estimates but included both time and cost estimates to allow time/cost trade-offs to be used. Both methods employed networks to schedule and display task sequences. (Throughout this chapter, we will use the words “activity” and “task” as synonyms to avoid constant repetition of one or the other.) Both methods identified a critical path of tasks that could not be delayed without delaying the project. Both methods identified activities with slack (or float) that could be somewhat delayed without extending the time required to complete the project. While PERT and CPM used slightly different ways of drawing the network of activities, anything one could do with PERT, one could also do with CPM and vice versa. When writing about the history of project management, differentiating PERT and CPM is important and interesting. When managing projects, the distinction is merely academic. Traditional PERT is used less often than CPM; but CPM can be used with three-time estimates, and we can do things with PERT that were restricted to CPM in “olden times.” We use both names because users in the real world are apt to use either.
1. The Language of PERT/CPM
Several terms used in discussing PERT/CPM analysis have been adopted from everyday language but have quite different meanings than in common usage. These terms are defined here as used in PERT/CPM.
Activity—A task or set of tasks required by the project. Activities use resources and time.
Event—An identifiable state resulting from the completion of one or more activities. Events consume no resources or time. Before an event can be achieved or realized, all its predecessor activities must be completed.
Milestones—Identifiable and noteworthy events marking significant progress on the project.
Network—A diagram of nodes (may represent activities or events) connected by directional arcs (may represent activities or simply show technological dependence) that defines the project and illustrates the technological relationships of all activities. Networks are usually drawn with a “Start” node on the left and a “Finish” node on the right. Arcs are always tipped with an arrowhead to show the direction of precedence, that is, from predecessors to successors.
Path—A series of connected activities (or intermediate events) between any two events in a network.
Critical path—The set of activities on a path from the project’s start event to its finish event that, if delayed, will delay the completion date of the project.
Critical time—The time required to complete all activities on the critical path.
In Chapter 3, on planning, we noted that tasks may be divided into subtasks and each of the subtasks may be further divided. To carry out this process, it is necessary to know which tasks are immediate predecessors or successors of which others. The predecessor/ successor relationship defines technological dependence. (See Chapter 3, Section 3.3.)
2. Building the Network
There are two ways of displaying a project network. In one we depict the activities as arrows and events as nodes. This gives an activity-on-arrow (AOA) network, usually associated with PERT. Alternatively, we can create an activity-on-node (AON) network by showing each task as a node and linking the nodes with arrows that show their technological relationship. The AON network is often associated with CPM. To understand the distinction, let us assume a small project represented by the tasks and precedences shown in Table 5-1.
Because it is easiest to draw, we start with the AON network. Because tasks a and b have no predecessors, they follow the Start node. We connect them to the starting node with arrows as in Figure 5-1.
Note that task c has a as a predecessor and that tasks d and e have b as their common predecessor as shown in Figure 5-2.
The network is easily completed. Task f has both c and d as predecessors, while g follows e. Because there are no more tasks, we can tie all loose ends to a node labeled Finish as in Figure 5-3.
The AOA network is generally more difficult to draw, but depicts the technical relationships of the activities quite well. Beginning the same way, we create a Start node from which flow all activities that have no predecessors, in this case a and b. The completion of these activities results in events (nodes, often drawn as circles) numbered 1 and 2 for easy identification as in Figure 5-4.


Table 5-1 indicates that task a precedes task c, and that task b precedes both tasks d and e. Figure 5-5 shows these additions with event nodes 3, 4, and 5, as indicated.
We are left with two activities, f and g. Task f has two predecessors, c and d. This means that tasks c and d actually finish at the same node (or event) and that f cannot start until this event is achieved, that is, until both c and d are completed. Task g is preceded by e. Table 5-1 shows no more tasks, and as in the case of the AON network this means that all tasks with no successors should go to a node labeled Finish. See Figure 5-6(a) in which the nodes have been renumbered and some combined for viewing simplicity.
We can handle f in a simpler though equivalent way by connecting the nodes following c and d in Figure 5-5 with an arrow drawn with a dashed line, see Figure 5-6(b). This is called a dummy activity and merely shows a technological linkage. Generally speaking, dummy tasks are used in situations where two activities have the same starting and finishing nodes or where a single activity connects to two or more nodes. The problem with two activities sharing the same starting and finishing nodes is that it becomes difficult to distinguish the tasks from one another. One solution to this problem is to add an extra ending node for one of the tasks and then draw a dummy task from the new node to the previously shared node. Adding a dummy task in this situation ensures that the tasks have unique identities while at the same time maintaining the correct technological precedence relationships. Dummy tasks require no time and no resources.
With occasional exceptions for clarity, we will use AON networks throughout this book because they are used by most of the popular project management software. An important advantage of AON notation is that the networks are easy to draw. AOA networks, particularly when they have more than 15 or 20 activities, are difficult to draw by hand. With modern software this is not a serious problem, but the software that generates AOA networks is quite expensive. AON networks often do not show events, but it is simple enough to add them by showing the event (usually a milestone) exactly as if it were an activity but with zero time duration and no resources. The PM should be familiar with both types of networks.


3. Finding the Critical Path and Critical Time
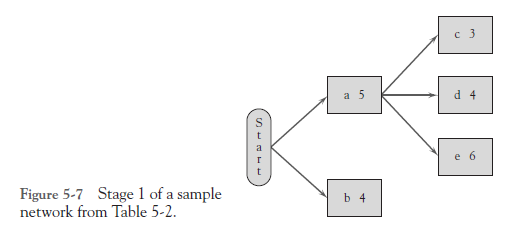
Let us now consider a more complicated example. Given the data in Table 5-2, we can start drawing the associated AON network as in Figure 5-7. The activity names and durations are shown in the appropriate nodes.
Note that activity f follows both b and c. If we redraw Figure 5-7 and place the c node below the d and e nodes, we will avoid having several of the arrows crossing one another; see Figure 5-8 for the complete network. This kind of rearrangement is quite common when drawing networks, and most software will allow the user to click and drag nodes around to avoid the confusion of too many crossing arrows.
We can add information to the nodes in the network. Just above each node it is common practice to show what is called the earliest start time (ES) and earliest finish time (EF) for the associated activity. Just below each node is shown the latest start time (LS) and latest finish time (LF) for the activity. The node would appear as in Figure 5-9. The corresponding information for Figure 5-8 is shown in Figure 5-10 and its derivation is described in detail just below.
Activities a and b may start on Day 0, their ESs. Their EFs will be equal to their durations, 5 and 4 days, respectively. Tasks c, d, and e cannot start before a is completed on Day 5. Adding their respective durations to their ESs gives us their EFs, c finishing on Day 8, d on Day 9, and e on Day 11. Task f cannot start before both b and c are finished on Day 8, resulting in the EF for f on Day 12. Similarly, we find EFs for tasks g (9 + 5 = 14) and h (11 + 6 = 17). Recall that a successor cannot be started until all predecessors are completed. Thus, h cannot start until Day 11 when both d and e are finished—Days 9 and 11, respectively. The same situation is true for task j. It cannot be started until both g and h are completed on Day 17, giving an EF of 17 + 4 = 21. Task i, following f, has an EF of 12 + 6 = 18. No tasks follow i and j, completed on Days 18 and 21, respectively. When they are both finished, the project is finished. That event occurs on Day 21.

All activities, and thus all paths, must be completed to finish the project. The shortest time for completion of the network is equal to the longest path through the network, in this case a-e-h-j. If any activity on the a-e-h-j path is even slightly delayed, the project will be delayed and that identifies a-e-h-j as the critical path and 21 days as the critical time. In Figure 5-10 the critical path is depicted by thick lines—a common practice with PERT/CPM networks. We found the ES and EF for each activity quite easily by beginning at the start node and moving from left to right through the network, calculating as we go from node to node. This is called a “forward pass” (or “left-to-right pass”) and makes it simple to find the critical path and time for PERT/CPM networks.
In a similar fashion, we can perform a “backward pass” (or “right-to-left pass”) to calculate the LS and LF values for each activity. Referring to Figure 5-10, we begin by assuming that we would like to complete the project within the critical time identified in the forward pass, 21 days in our example. Clearly, activities i and j must be completed no later than Day 21 in order not to delay the entire project. Therefore, these activities both have LFs of 21.
Given a task time of 4 days, j must be started no later than Day 17 in order to be completed by Day 21. Likewise, task i can be started as late as Day 15 and still finished by Day 21 given its 6-day task time. Because task j cannot be started any later than Day 17, tasks g and h must be completed by Day 17. In a similar fashion, task f must be completed by Day 15 so as not to delay task i beyond its LS. Subtracting the task times from the LF for each of the tasks yields LSs of 11, 11, and 12 for tasks f, h, and g, respectively.
Now consider task d. Task d precedes both tasks g (LS = 12) and h (LS = 11). The question is, should d’s LF be 11 or 12? The correct answer is 11. The reason being, if task d were completed on Day 12, task h could not start on its LS of Day 11. Therefore we note that in situations where a particular activity precedes more than one task, its LF is equal to the minimum LSs of all activities it precedes.
The LFs and LSs for tasks b, c, and e are easily calculated since each of these tasks precedes a single task. Task a precedes tasks c, d, and e. Because task e has the lowest LS of 5 days, the LF for task a is calculated to be 5 days.
4. Calculating Activity Slack
If activities on the critical path cannot be delayed without causing the entire project to be delayed, does it follow that activities not on the critical path can be delayed without delaying the project? As a matter of fact, it does—within limits. The amount of time a noncritical task can be delayed without delaying the project is called slack or float. The slack for any activity is easily calculated as LS — ES = LF — EF = slack.
It should be clear that for any task on the critical path, its LF must be the same as its EF. It therefore has zero slack. If it finishes later than its EF, the activity will be late, causing a delay in the project. (Of course, the statement is equally true for its LS and ES.) This rule holds for activities a, e, h, and j, all on the critical path. But for activities not on the critical path the LF and EF (or the LS and ES) will differ and this difference is the activity slack. Take activity i, for example. It could be completed as early as Day 18 because its ES is Day 12 and it has a 6-day duration. It must, however, be completed by Day 21 or the project will be delayed. Because i has a duration of 6 days, it cannot be started later than Day 15 (21 — 6). Given an LS of 15 and an ES of 12, task i could be delayed up to 3 days (LS — ES or LF — EF) without affecting project completion time. Thus, activity i has 3 days of slack.
For another example, consider task g. It is a predecessor to task j that is on the critical path. Task j must start on Day 17, which gives task g an LF of 17. It has an EF of Day 14 and thus has 3 days of slack.
Now consider a more complex situation: task d. First, task d must be completed by Day 12 so as not to make g late and thus j late and thereby the whole project late! Thus, along this path task d has 3 days of slack in the role as a predecessor of task g. But d is also a predecessor of critical activity h, and along this path task d must be completed by Day 11 or h will be late to start. Task d, therefore, has only 2 days of slack, not 3.
Slack for other tasks are determined in the same way. Task f precedes i, and the latter has an LS of Day 15. Given an LF of 15, f must start no later than Day 11. Its ES of Day 8 means that f has 3 days of slack. Task c is a predecessor of f, and because the latter’s LS is Day 11, c must be completed by then. With an LF of 11 and an EF of 8, c has 3 days of slack. The only remaining task to be considered is b. This task is linked to f and, like c, must be complete by f’s LS, Day 11. With an EF of Day 4, b has 7 days of slack.
Throughout this discussion of calculating slack, we have made two assumptions that are standard in these analyses. First, when calculating slack for a set of activities on a noncritical path, the calculation for any given activity assumes that no other activity on the path will use any of the slack. Once a project is underway, if a predecessor activity uses some of its slack, its EF is adjusted accordingly and the ESs of successor activities must also be corrected. We have also assumed that the critical time for the project is also the project’s due date, but it is not uncommon for a project to have “project slack” (or “network slack”). Our 21-day project might be started 23 days before its promised delivery date, in which case activities on the “critical path” would have 2 days of slack and noncritical activities would have an additional 2 days of slack.
Milestones may be added to the display quite easily: Add the desired milestone event as a node with zero duration. Its ES will equal its EF, and its LS and LF will be equal. Milestones should, of course, be immediate successors of the activities that result in the milestone events. Finally, if a starting date has been selected for the project, it is common to show ES, EF, LS, and LF as actual dates.
Before continuing, a pause is in order to consider the managerial implications of the critical path and slack. The PM’s primary attention must be paid to activities on the critical path. If anything delays one of these activities, the project will be late. At the start of the project, the PM correctly notes that activity a is on the critical path and b is not. This raises an interesting question. Can any resources reserved for use on b be borrowed for a few days to work on a and thereby shorten its duration? The nature of b’s resources and a’s technology will dictate whether or not this is possible. If a, for example, could be shortened a day by using b’s resources for 4 days, the critical path would be shortened by a day. This would cause no problem for b, which had 7 days of slack. If the delivery date for the project remains the same, the entire project would then have a day of slack. The presence of project slack tends to lower the PM’s pulse rate and blood pressure.
5. Doing It the Easy Way—Microsoft Project (MSP)
As promised, once the reader understands how to build a network by hand, we can introduce tools provided through project management software. The first task is transferring information from the project plan into the software, MSP in this case. This is not difficult. MSP presents a tab entry table much like the project plan template shown in Table 5-3. It has spaces where the tasks can be identified, plus spaces for activity durations and predecessors. The software automatically numbers each activity that is entered. MSP offers a great number of options for viewing the data once it is entered into the project plan or entry view. If a specific start date or finish date is already determined for an activity, MSP allows you to enter it as well.
Once the project plan data are entered, MSP will automatically draw an AON PERT/CPM network as shown in Figure 5-11. Note that the figure lacks start and finish nodes because they were not entered on the activity list. Note also that the tasks in the network appear with ID numbers in order, flowing from left to right and from the top to the bottom. In Figure 5-11 two arrows cross, which may be confusing. The nodes show the activity name, ID number, duration, and start and finish times. These nodes are easily customized to show many different things concerning each specific activity.


It is simple to add Start and Finish nodes as milestones to make the network easier to understand. An activity named “Start” is entered at the top of the list, and an activity named “Finish” at the bottom. We want these activities to appear as milestones, significant events in the life of the project. In MSP a milestone is an activity with a duration of 0. Because we want the Start and Finish milestones to be linked to the beginning and ending activities of the project, all predecessors will have to be changed in light of these additions. For example, a and b will now have Start as a predecessor, and the last two activities, i and j, are predecessors to Finish. (In MSP, predecessors are indicated by task ID numbers rather than the task names used here for clarity.)

Redrawing the network to get rid of the crossing arrows is also simple. As we noted when drawing the network manually, this is corrected by moving the c, f, and i nodes down to the bottom of the network. In MSP, that is easily done by simply dragging the nodes to whatever location you wish. See Figure 5-12 for the results of both changes. Notice in Figure 5-12 that because we added Start and Finish to the activity list, the other activities have been renumbered to conform to the changed list.
MSP will also calculate slack. (For details, click on MSP’s follow the directions.) MSP, and some writers, differentiate between “total slack” and “free slack.” Total slack is LF — EF or LS — ES as we explained in the section just above. Free slack is defined as the time an activity can be delayed without affecting the start time of any successor activity. Take activity b for example. Its EF is 4 days, but it could be finished as late as 8 days without affecting task f in any way. It is thus said to have 4 days of free slack. Using b as an example, the rule for calculating free slack for an activity is
Free slack for b = ES of earlier successor — b’s ES — b’s duration
4 = 8-0-4.
The total slack for b is seven days, as we calculated in the section on finding slack.
These same calculations can be done by using the Solver in Excel®. To see how this is accomplished, refer to Lawrence and Pasternak (1998, Chapters 5 and 6). Finding the critical path is a fairly straightforward problem in linear programming, but it often takes more time than doing the same problem by hand, and certainly much more time (entering the required information) than letting MSP solve the problem.
Following the definition of some terms commonly used in PERT/CPM analysis, both AON and AOA networks are illustrated. ES and EF are found for all network activities, and the critical time and critical path are identified by the forward-pass method. LS and LF are calculated for all activities by the backward-pass method, and slack is defined as either LS — ES or LF — EF. The managerial implications of the critical path and of project slack are briefly discussed. The same problem used for illustrating networks is entered into MSP and shown as an output of the software.
Source: Meredith Jack R., Mantel Jr. Samuel J., Shafer Scott M., Sutton Margaret M. (2017), Project Management in Practice, John Wiley & Sons, Inc. 3th Edition.
Keep working ,splendid job!