As noted earlier, a major trend occurring in organizations is the use of project management to implement the organization’s strategic objectives, especially organizational change. Organizations spend about $100 billion a year on creating competitive strategies (Morgan et al., 2007, p. 1), yet 90 percent of them (thousands) fail due to poor execution of these projects. This has stimulated a variety of new research into why these projects, even when successful, often don’t attain the strategic benefits the organization desired. Some of these research streams are called “change management,” “benefit realization management,” and other such terms. One new approach gaining attention has been the creation of a new position in the project governance structure called the “project owner,” an agent of the funding organization with the responsibility of ensuring that the project results in the strategic benefits desired by the funder (Zwikael et al., 2015). The project owner works closely with the project manager and the executive “sponsor” (champion) of the project in the project manager’s organization, as well as all project stakeholders, to ensure that the strategic benefits are realized when the project is eventually implemented and operationalized.
Not all of an organization’s projects will be strategy implementation or organizational change projects, but all of the projects in the organization’s portfolio should be consistent with the organization’s strategic goals. In what follows, we first discuss a variety of common project selection methods. We then describe the process of strategically selecting the best set of projects for implementation, called the Project Portfolio Process.
Project selection is the process of evaluating individual projects or groups of projects and then choosing to implement a set of them so that the objectives of the parent organization are achieved. Before a project begins its life cycle, it must have been selected for funding by the parent organization. Whether the project was proposed by someone within the organization or an outside client, it is subject to approval by a more or less formal selection process. Often conducted by a committee of senior managers, the major function of the selection process is to ensure that several conditions are considered before a commitment is made to undertake any project. These conditions vary widely from firm to firm, but several are quite common: (1) Is the project potentially profitable? Does it have a chance of meeting our return-on-investment hurdle rate? (2) Is the project required by law or the rules of an industrial association; i.e., a “mandate?” (3) Does the firm have, or can it easily acquire, the knowledge and skills to carry out the project successfully? (4) Does the project involve building competencies that are considered consistent with our firm’s strategic plan? (5) Does the organization currently have the capacity to carry out the project on its proposed schedule? (6) In the case of R&D projects, if the project is technically successful, does it meet all requirements to make it economically successful? This list could be greatly extended.
The selection process is often complete before a PM is appointed to the project. Why, then, should the PM be concerned? Quite simply, the PM should know exactly why the organization selected the specific project because this sheds considerable light on what the project (and hence the PM) is expected to accomplish, from senior management’s point of view, with the project. The project may have been selected because it appeared to be profitable, or was a way of entering a new area of business, or a way of building a reputation of competency with a new client or in a new market. This knowledge can be very helpful to the PM by indicating senior management’s goals for the project, which will point to the desirability of some trade-offs and the undesirability of others.
There are many different methods for selecting projects, but they may be grouped into two fundamental types, nonnumeric and numeric. The former does not use numbers for evaluation; the latter does. At this point it is important to note that many firms select projects before a detailed project plan has been developed. Clearly, if the potential project’s scope, budget, and due dates have not been determined, it will be quite impossible to derive a reasonably accurate estimate of the project’s success. Rough estimations may have to suffice in such cases, but specific plans should be developed prior to final project selection. Obviously, mandated projects are an exception. For mandates, budget estimates do not matter but scope and due dates are still important. Mandates must be selected. We will deal further with the selection problem when we consider the Project Management Office in Chapter 2.
1. Nonnumeric Selection Methods
The Sacred Cow At times, the organization’s Chief Executive Officer (CEO) or other senior executive either formally or casually suggests a potential product or service that the organization might offer to its customers. The suggestion often starts, “You know, I was thinking that we might . . .” and concludes with “. . . Take a look at it and see if it looks sensible. If not, we’ll drop the whole thing.”
Whatever the selection process, the aforementioned project will be approved. It becomes a “Sacred Cow” and will be shown to be technically, if not economically, feasible. This may seem irrational to new students of project management, but such a judgment ignores senior management’s intelligence and valuable years of experience—as well as the subordinate’s desire for long-run employment. It also overlooks the value of support from the top of the organization, a condition that is necessary for project success (Green, 1995).
The Operating/Competitive Necessity This method selects any project that is necessary for continued operation of a group, facility, or the firm itself. A “mandated” project obviously must be selected. If the answer to the “Is it necessary . . . ?” question is “yes,” and if we wish to continue using the facility or system to stay in business, the project is selected. The Investment Committee of a large manufacturing company started to debate the advisability of purchasing and installing pumps to remove 18 inches of flood water from the floor of a small, but critical production facility. The debate stopped immediately when one officer pointed out that without the pumps the firm was out of business.
The same questions can be directed toward the maintenance of a competitive position. Some years ago, General Electric almost decided to sell a facility that manufactured the large mercury vapor light bulbs used for streetlights and lighting large parking lots. The lighting industry had considerable excess capacity for this type of bulb and the resulting depressed prices meant they could not be sold profitably. GE, however, felt that if they dropped these bulbs from their line of lighting products, they might lose a significant portion of all light bulb sales to municipalities. The profits from such sales were far in excess of the losses on the mercury vapor bulbs.
Comparative Benefits Many organizations have to select from a list of projects that are complex, difficult to assess, and often noncomparable, for example, United Way organizations and R&D organizations. Such institutions often appoint a selection committee made up of knowledgeable individuals. Each person is asked to arrange a set of potential projects into a rank-ordered set. Typically, each individual judge may use whatever criteria he or she wishes to evaluate projects. Some may use carefully determined technical criteria, but others may try to estimate the project’s probable impact on the ability of the organization to meet its goals. While the use of various criteria by different judges may trouble some, it results from a purposeful attempt to get as broad a set of evaluations as possible.
Rank-ordering a small number of projects is not inherently difficult, but when the number of projects exceeds 15 or 20, the difficulty of ordering the group rises rapidly. A Q-sort is a convenient way to handle the task. First, separate the projects into three subsets, “good,” “fair,” and “poor,” using whatever criteria you have chosen—or been instructed to use. If there are more than seven or eight members in any one classification, divide the group into two subsets, for instance, “good-plus” and “good-minus.” Continue subdividing until no set has more than seven or eight members. Now, rank-order the items in each subset. Arrange the subsets in order of rank, and the entire list will be in order. Last, review the stack and shift any cards that seem out of place until the classifications are satisfactory.
The committee can make a composite ranking from the individual lists any way it chooses. One way would be to number the items on each individual list in order of rank, and then add the ranks given to each project by each of the judges. Projects may then be approved in the order of their composite ranks, at least until the organization runs out of available funds.
2. Numeric Selection Methods
Financial Assessment Methods Most firms select projects on the basis of their expected economic value to the firm. Although there are many economic assessment methods available—payback period, average annual rate of return, internal rate of return, and so on—we will describe here two of the most widely used methods: payback period and discounted cash flow.
The payback period for a project is the initial fixed investment in the project divided by the estimated annual net cash inflows from the project (which include the cash inflows from depreciation of the investment). The ratio of these quantities is the number of years required for the project to return its initial investment. Because of this perspective, the payback period is often considered a surrogate measure of risk to the firm: the longer the payback period, the greater the risk. To illustrate, if a project requires an investment of $100,000 and is expected to return a net cash inflow of $25,000 each year, then the payback period is simply 100,000/25,000 = 4 years, assuming the $25,000 annual inflow continues at least 4 years. Although this is a popular financial assessment method, it ignores the time value of money as well as any returns beyond the payback period. For these reasons, it is not recommended as a project selection method, though it is valuable for cash budgeting. Of the financial assessment methods, the discounted cash flow method discussed next is recommended instead.
The discounted cash flow method considers the time value of money, the inflation rate, and the firm’s return-on-investment (ROI) hurdle rate for projects. The annual cash inflows and outflows are collected and discounted to their net present value (NPV) using the organization’s required rate of return (a.k.a. the hurdle rate or cutoff rate).
![]()
where
I0 = the initial investment, which will be negative because it is an outflow
Ft = the net cash flow in period t
k = the required rate of return or hurdle rate
n = number of periods in life of project
If one wishes to include the potential effects of inflation or deflation in the calculation, it is quite easily done. The discounting term, (1 + k)t, simply becomes (1 + k + pt)t, where pt is the estimated rate of inflation or deflation for period t. If the required rate of return is 10 percent and we expect the rate of inflation will be 3 percent, then the discount term becomes (1 + .10 + .03)t = (1.13)t for that period.
In the early years of a project when outflows usually exceed inflows, the NPV of the project for those years will be negative. If the project becomes profitable, inflows become larger than outflows and the NPV for those later years will be positive. If we calculate the present value of the net cash flows for all years, we have the NPV of the project. If this sum is positive, the project may be accepted because it earns more than the required rate of return. The following boxed example illustrates these calculations. For clarity and convenience in the analysis, we have chosen to illustrate the calculations using Excel®’s NPV function rather than using the NPV formula.
Ceramic Sciences, Inc.*
Ceramic Sciences, Inc. (CSI) is a large producer of decorative ceramic pots. The firm is considering the installation of a new manufacturing line that will, it is hoped, improve the quality of its pots as well as their vases designed to hold artificial flowers.
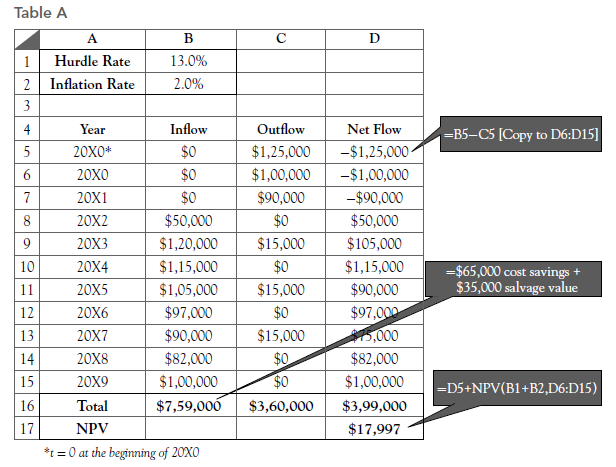
The plant engineering department has submitted a project proposal that estimates the following investment requirements: an initial investment of $125,000 to be paid up-front to the Pocketa Machine Corporation, an additional investment of $100,000 to install the machines, and another $90,000 to add new material handling systems and integrate the new equipment into the overall production system. Delivery and installation is estimated to take 1 year, and integrating the entire system should require an additional year. Thereafter, the engineers predict that scheduled machine overhauls will require further expenditures of about $15,000 every second year, beginning in the fourth year. They will not, however, overhaul the machinery in the last year of its life.
The project schedule calls for the line to begin production in the third year, and to be up-to-speed by the end of that year. Projected manufacturing cost savings and added profits resulting from higher quality are estimated to be $50,000 in the first year of operation and are expected to peak at $120,000 in the second year of operation, and then to follow the gradually declining pattern shown in Table A.
Project life is expected to be 10 years from project inception, at which time the proposed system will be obsolete and will have to be replaced. It is estimated that the machinery will have a salvage value of $35,000. CSI has a 13 percent hurdle rate for capital investments and expects the rate of inflation to be about 2 percent per year over the life of the project. Assuming that the initial expenditure occurs at the beginning of the year and that all other receipts and expenditures occur as lump sums at the end of the year, we can prepare the Net Present Value analysis for the project as shown in Table A. Note that Excel’s built in Net Present Value function NPV was used to facilitate the analysis. The NPV function has two arguments: the discount rate and the range that contains the cash flows to be discounted.
Because the first cash flow of – $125,000 occurs at the beginning of the first period, there is no need to discount it as it is already in present value terms. The remaining cash flows are assumed to occur at the end of their respective periods. For example, the $115,000 cash flow associated with 20X4 is assumed to occur at the end of the fifth period. According to the results, the Net Present Value of the project is positive and, thus, the project can be accepted. (The project would have been rejected if the hurdle rate had been 15 percent or if the inflation rate was 4 percent, either one resulting in a discount rate of 17 percent.)
Perhaps the most difficult aspect related to the proper use of discounted cash flow is determining the appropriate discount rate to use. While this determination is made by senior management, it has a major impact on project selection, and therefore, on the life of the PM. For most projects the hurdle rate selected is the organization’s cost of capital, though it is often arbitrarily set too high as a general allowance for risk. In the case of particularly risky projects, a higher hurdle rate may be justified, but it is not a good general practice. If a project is competing for funds with alternative investments, the hurdle rate may be the opportunity cost of capital, that is, the rate of return the firm must forego if it invests in the project instead of making an alternative investment. Another common, but misguided practice is to set the hurdle rate high as an allowance for resource cost increases. Neither risk nor inflation should be treated so casually. Specific corrections for each should be made if the firm’s management feels it is required. We recommend strongly a careful risk analysis, which we will discuss in further detail throughout this book.
Because the present value of future returns decreases as the discount rate rises, a high hurdle rate biases the analysis strongly in favor of short-run projects. For example, given a rate of 20 percent, a dollar 10 years from now has a present value of only $.16, (1/1.20)10 = 0.16. The critical feature of long-run projects is that costs associated with them are spent early in the project and have high present values while revenues are delayed for several years and have low present values.
This effect may have far-reaching implications. The high interest rates during the 1970s and 1980s, and again in the 2000s, forced many firms to focus on short-run projects. The resulting disregard for long-term technological advancement led to a deterioration in the ability of some U.S. firms to compete in world markets (Hayes and Abernathy, 1980).
The discounted cash flow methods of calculation are simple and straightforward. Like the other financial assessment methods, it has a serious defect. First, it ignores all nonmonetary factors except risk. Second, because of the nature of discounting, all the discounted methods bias the selection system by favoring short-run projects. Let us now examine a selection method that goes beyond assessing only financial profitability.
Financial Options and Opportunity Costs A more recent approach to project selection employs financial analysis that recognizes the value of positioning the organization to capitalize on future opportunities. It is based on the financial options approach to valuing prospective capital investment opportunities. Through a financial option an organization or individual acquires the right to do something but is not required to exercise that right. For example, you may be familiar with stock options. When a person or organization purchases a stock option, they acquire the right to purchase a specific number of shares of a particular stock at a specified price within a specified time frame. If the market price of the stock moves above the specified option price within the specified time frame, the entity holding the option can exercise its right and thereby purchase the stock below the fair market price. If the market price of the stock remains below the specified option price, the entity can choose not to exercise its right to buy the stock.
To illustrate the analogy of financial options to project selection, consider a young biotech firm that is ready to begin clinical trials to test a new pharmaceutical product in humans. A key issue the company has to address is how to produce the drug both now in the low volumes needed for the clinical trials and in the mass quantities that will be needed in the future should the new drug succeed in the clinical trial phase. Its options for producing the drug in low volumes for the clinical trials are to invest in an in-house pilot plant or to immediately license the drug to another company. If it invests in an in-house pilot plan, it then has two future options for mass producing the drug: (1) invest in a commercial scale plant or (2) license the manufacturing rights. In effect then, investing now in the pilot plant provides the pharmaceutical company with the option of building a commercial scale plant in the future, an option it would not have if it chooses to license the drug right from the start. Thus by building the in-house pilot plant the pharmaceutical company is in a sense acquiring the right to build a commercial plant in the future. While beyond the scope of this book, we point out to the reader that in addition to the traditional approaches to project selection, the decision to build the pilot plant can also be analyzed using valuation techniques from financial options theory. In this case the value of having the option to build a commercial plant can be estimated.
In addition to considering the value of future opportunities a project may provide, the cost of not doing a project should also be considered. This approach to project selection is based on the well-known economic concept of “opportunity cost.” Consider the problem of making an investment in one of only two projects. An investment in Project A will force us to forgo investing in Project B, and vice versa. If the return on A is 12 percent, making an investment in B will have an opportunity cost of 12 percent, the cost of the opportunity forgone. If the return on B is greater than 12 percent, it may be preferred over selecting Project A.
The same selection principle can be applied to timing the investment in a given project. R&D projects or projects involving the adoption of new technologies, for example, have values that may vary considerably with time. It is common for the passage of time to reduce uncertainties involved in both technological and commercial projects. The value of investing now may be higher (or lower) than investing later. If a project is delayed, the values of its costs and revenues at a later period should be discounted to their present value when compared to an investment not delayed.
Occasionally, organizations will approve projects that are forecast to lose money when fully costed and sometimes even when only direct costed. Such decisions by upper management are not necessarily foolish because there may be other, more important reasons for proceeding with a project, such as to:
- Acquire knowledge concerning a specific or new technology
- Get the organization’s “foot in the door”
- Obtain the parts, service, or maintenance portion of the work
- Allow them to bid on a lucrative, follow-on contract
- Improve their competitive position
- Broaden a product line or line of business
Of course, such decisions are expected to lose money in the short term only. Over the longer term they are expected to bring extra profits to the organization. It should be understood that “lowball” or “buy-in” bids (bidding low with the intent of cutting corners on work and material, or forcing subsequent contract changes) are unethical practices, violate the PMI Code of Ethics for Project Managers (see PMBOK, p. 2, 2013), and are clearly dishonest.
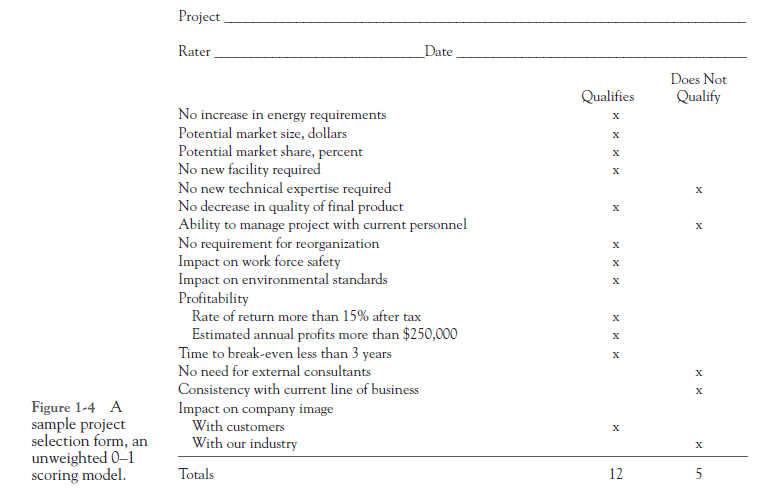
Scoring Methods Scoring methods were developed to overcome some of the disadvantages of the simple financial profitability methods, especially their focus on a single criterion. The simplest scoring approach, the unweighted 0-1 factor method, lists multiple criteria of significant interest to management. Given a list of the organization’s goals, a selection committee, usually senior managers familiar with both the organization’s criteria and potential project portfolio, check off, for each project, which of the criteria would be satisfied; for example, see Figure 1-4. Those projects that exceed a certain number of check-marks may be selected for funding.
All the criteria, however, may not be equally important and the various projects may satisfy each criterion to different degrees. To correct for these drawbacks, the weighted factor scoring method was developed. In this method, a number of criteria, n, are considered for evaluating each project, and their relative importance weights, w., are estimated. The sum of the weights over all the j criteria is usually set arbitrarily at 1.00, though this is not mandatory. It is helpful to limit the criteria to just the major factors and not include criteria that are only marginal to the decision, such as representing only 2 or 3 percent importance. A rule of thumb is to keep n less than eight factors because the more important factors with weights of, say 20 percent or more force the weights of the less important factors to be insignificant. The importance weights, w., can be determined in any of a number of ways: a particular individual’s subjective belief, available objective factors such as surveys or reports, group composite beliefs such as simple averaging among the group members, and so on.
In addition, a score, sij, must be determined for how well each project i satisfies each criterion j. Each score is multiplied by its category weight, and the set of scores is summed to give the total weighted score, S. = 2. sij Wj for each project, i, from which the best project is then selected. Typically, a 5-point scale is used to ascertain these scores, though 3-, 7-, and even 9-point scales are sometimes used. The top score, such as 5, is reserved for excellent performance on that criterion such as a return on investment (ROI) of 50 percent or more, or a reliability rating of “superior.” The bottom score of 1 is for “poor performance,” such as an ROI of 5 percent or less, or a reliability rating of “poor.” The middle score of 3 is usually for average or nominal performance (e.g., 15-20% ROI), and 4 is “above average” (21-49% ROI) while 2 is “below average” (6-14% ROI). Notice that the bottom score, 1, on one category may be offset by very high scores on other categories. Any condition that is so bad that it makes a project unacceptable, irrespective of how good it may be on other criteria, is a constraint. If a project violates a constraint, it is removed from the set and not scored.
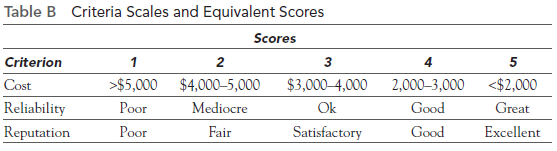
Note two characteristics in these descriptions. First, the categories for each scale need not be in equal intervals—though they should correspond to the subjective beliefs about what constitutes excellent, below average, and so on. Second, the five- point scales can be based on either quantitative or qualitative data, thus allowing the inclusion of financial and other “hard” data (cash flows, net present value, market share growth, costs) as well as “soft” subjective data (fit with the organization’s goals, personal preferences, attractiveness, comfort). And again, the soft data also need not be of equal intervals. For example, “superior” may rate a 5 but “OK” may rate only a 2.
The general mathematical form of the weighted factor scoring method is
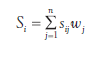
where
St = the total weighted score of the ith project
Sj = the score of the ith project on the jth criterion
Wj = the weight or importance of the jth criterion
Using a Weighted Scoring Model for an Election Campaign Project
As the campaign manager to elect Jennifer Allison to the city council, you have determined that winning the election is largely dependent on Jennifer’s name recognition. One idea for increasing Jennifer’s name recognition is to distribute car bumper stickers with her name on them. In selecting a vendor to design and print the bumper stickers, you have two primary criteria of equal importance, cost and the reliability of the printer to complete the work on time. You have a limited budget for the bumper stickers and would like to spend no more than $4,200. Beyond cost and reliability, the reputation of the vendor for developing bold and aesthetically pleasing designs is also an important consideration. Upon further reflection and since this is only a bumper sticker, you determine that the reputation of the vendor is only half as important as either cost or reliability. Table B shows a set of scales you created for the three criteria, converted into quantitative scores.
Table B Criteria Scales and Equivalent Scores
You have identified three possible vendors to design and print the bumper stickers. In Table C, you have scored each of the vendors on each of the criteria, calculated their weighted scores, and summed them to get a total. The weights for the criteria were obtained from the following logic: If Y is the importance weight for Cost, then Y is also the importance for Reliability and VtX is the importance for Reputation. This results in the formula
![]()
Thus, Cost has 0.4 importance weight, as does Reliability, and Reputation has 0.2 importance.
Table C Weighted Total Scores for Each Vendor
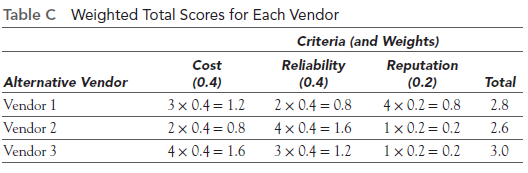
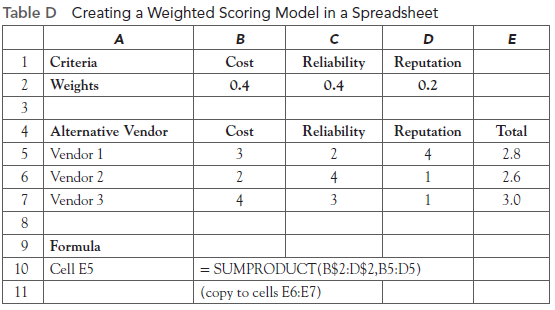
Based on this assessment, it appears that the Vendor 3 with a total weighted score of 3.0 may best satisfy your need for bumper stickers. As shown in Table D, spreadsheets are a particularly useful tool for comparing options using a weighted scoring model.
Table D Creating a Weighted Scoring Model in a Spreadsheet
Project selection is an inherently risky process. Throughout this section we have treated risk by “making allowance” for it. Managing and analyzing risk can be handled in a more straightforward manner. By estimating the highest, lowest, and most likely values that costs, revenues, and other relevant variables may have, and by making some other assumptions about the world, we can estimate outcomes for the projects among which we are trying to make selections. This is accomplished by simulating project outcomes. In Section 4.5, we will demonstrate how to do this using Crystal Ball® (CB) on a sample selection problem.
Source: Meredith Jack R., Mantel Jr. Samuel J., Shafer Scott M., Sutton Margaret M. (2017), Project Management in Practice, John Wiley & Sons, Inc. 3th Edition.
I used to be recommended this web site by way of my cousin. I’m no longer sure whether or not this put up is written by him as no one else recognise such specific approximately my difficulty. You’re incredible! Thank you!