Is there a combination of gender, parents’ education, mosaic, and visualization test that predicts whether students will take algebra 2?
Let’s try a logistic regression to predict a dichotomous (two category) dependent variable when the independent variables (called covariates in SPSS) are either dichotomous or normal/scale.
First, we should check for multicollinearity. Because tolerance and VIF scores are not available through the logistic regression command, one way to compute these values is through the linear regression command, using algebra 2 as the dependent variable and gender, mosaic, visualization test, and parents’ education as independent variables. If you did this, you would find that the tolerance statistics are all above .87, so there is little multicollinearity. (See Problem 8.3 for how to do this.) Use these commands to compute the logistic regression:
- Analyze → Regression → Binary Logistic to get to 8.1.
- Move algebra 2 in h.s. into the Dependent variable box.
- Move gender, mosaic, visualization test, and parents’ education into the Covariates
- Make sure Enter is the selected Method. (This enters all the variables in the covariates box into the logistic regression equation simultaneously.)
- Click on Options to produce 8.2.
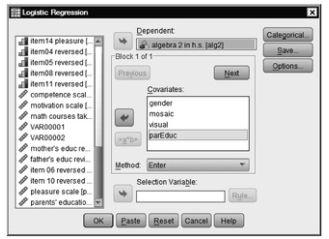
Fig. 8.1. Logistic regression.
- Check CI for exp(B), and be sure 95 is in the box (which will provide confidence intervals for the odds ratio of each predictor’s contribution to the equation).
- Click on Continue.
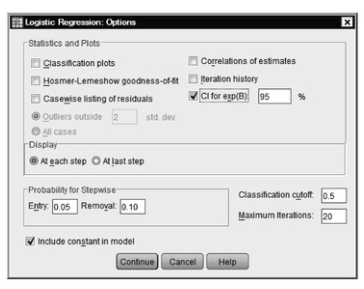
Fig. 8.2. Logistic regression: Options.
- Click on OK. Does your output look like Output 8.1?
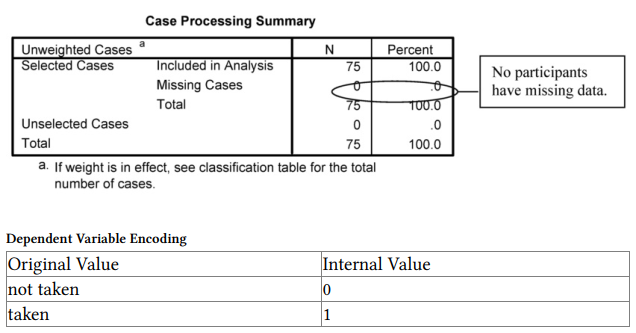
Output 8.1: Logistic Regression, Method = Enter
LOGISTIC REGRESSION VARIABLES alg2 /METHOD=ENTER gender mosaic visual parEduc
/PRINT=CI(95)
/CRITERIA=PIN(0.05) POUT(0.10) ITERATE(20) CUT(0.5).
Interpretation of Output 8.1
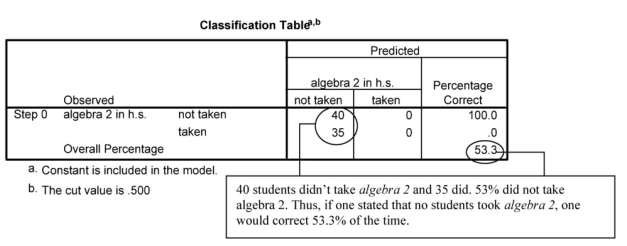
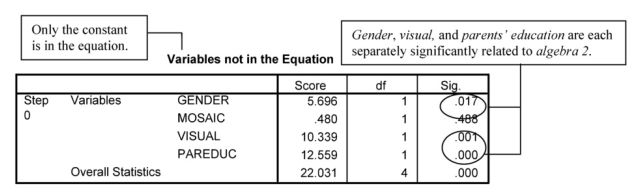
There are three main parts to this output. First, two tables provide descriptive information (see callout boxes). Next, there are three tables in Block 0 that provide information about the baseline situation, when only the constant is in the equation or model. That is, how well can we predict algebra 2 without using gender, parents’ education, mosaic, or visualization test, if we predicted that all the students would not take algebra 2? The last section of four tables is below Block 1. They show the results when the four predictors are entered simultaneously.
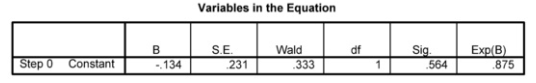
The first table under Block 0, the initial Classification Table, shows the percentage of correct predictions (53%) if all of the students were predicted to be in the larger (algebra 2 not taken) group. The first Variables in the Equation table shows that if you predicted that all students would not take algebra 2, the odds of successful prediction would not be significantly different from 50-50 (i.e., no better than chance).
Source: Leech Nancy L. (2014), IBM SPSS for Intermediate Statistics, Routledge; 5th edition;
download Datasets and Materials.
This web site is really a walk-through for all of the info you wanted about this and didn’t know who to ask. Glimpse here, and you’ll definitely discover it.