In Problem 7.4 we will assess the relationship between multiple scale independent variables and multiple scale dependent variables. This analysis is an extension of multiple regression. Recall with multiple regression there are multiple scale (or dichotomous) independent variables and one scale dependent variable. Yet, researchers are at times interested in more than one dependent variable. Here we will assess the relationship between the items that make up the motivation scale and the items that make up the competence scale.
- Retrieve hsbdataNEW.sav.
7.4. What is the pattern of relationships between the motivation items and the competence items?
We will need to check the assumptions of linearity, multivariate normality, and homoscedasticity. One way to do this is to graph the canonical variate scores that are generated by the canonical correlation syntax. Because the canonical correlation needs to be computed first, we have done that below, with the matrix scatterplot of the canonical variates afterward. Be sure not to save your data file after running these commands, or you will save the canonical variates.
Canonical correlation must be computed through syntax and requires access to the SPSS file for canonical correlation.
First, go to the website and download the file “Canonical correlation.sps” to your c: drive. If you download it to another location you will need to change the syntax to identify where the file is located. To check assumptions of canonical correlation, use these syntax to generate plots.
DATASET ACTIVATE DataSet1.
MANOVA item03 item09
WITH item01 item07 item12 item13
/DISCRIM ALL
/PLOT ALL.
The data appear to meet the assumptions of linearity, multivariate normality, and homoscedasticity because there does not appear to be a pattern in the scatterplots, and there are not large differences in how spread out each scatterplot is. Next, use the following syntax to answer the research question.
INCLUDE ‘c:\Canonical Correlation.sps’.
CANCORR SET1=item01 item07 item12 item13 /
SET2=item03 item09 /.
Output 7.4: Canonical Correlation Output
include ‘c:\canonical correlation.sps’.
1252 0 * Canonical correlation.sps. This version allows long variable names and uses datasets.Canonical correlation.sps.
1253 0
1255 0 preserve.
1257 0 set printback=off.
1961 0 RESTORE.
1962 0
1964 0 * End of INSERT and INCLUDE nesting level 01.
CANCORR SET1=item01 item07 item12 item13
SET2=item03 item09 .
Matrix
Interpretation of Outputs 7.4
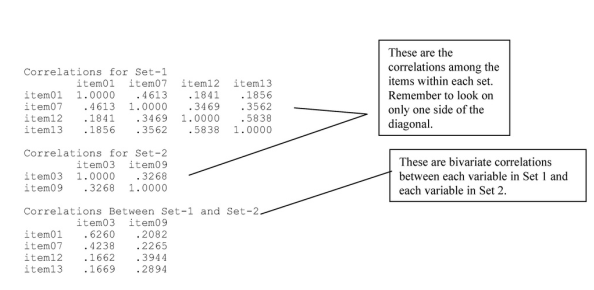
The first two matrices, Correlations for Set-1 and Correlations for Set-2, are ordinary correlation tables. The first matrix is for the variables in Set 1, and the second matrix is for the variables in Set 2. We can see from these tables that most variables in each set are weakly to moderately correlated with each other.
The next matrix is the Correlations Between Set-1 and Set-2, which contains the bivariate correlations between each variable in Set 1 and each variable in Set 2.
Source: Leech Nancy L. (2014), IBM SPSS for Intermediate Statistics, Routledge; 5th edition;
download Datasets and Materials.
28 Mar 2023
14 Sep 2022
22 Sep 2022
27 Mar 2023
20 Sep 2022
28 Mar 2023