Yes, AMOS allows you to use a correlation matrix as data input, but you need to include the standard deviation, mean, and sample size for each construct. Typically, you will see path models used when the data input is a correlation matrix instead of the raw data. For many correlation analyses, the researcher is using composite variables to determine the correlation between constructs. This makes it easy to transition to a path model in SEM. You can use a correlation matrix as the data input in a full structural model, but you would have to perform a correlation analysis with every indicator in the model. This could get a little burdensome and prone to input errors.
To use a correlation matrix as the input, you need to have the data set up in a very specific format in SPSS. Using our path model example, Figure 5.7 shows the specific format in SPSS if we wanted to use a correlation matrix as the input for the path model. If it is not in this for- mat, AMOS will not be able to read the data. Note that in the first column you need to label it “rowtype_” and the second column “varname_”. The next columns will be your construct names. In the first row will be your sample size, and the next rows will be your correlations between constructs. The next to last row is standard deviation, and the last row is the mean of the construct.
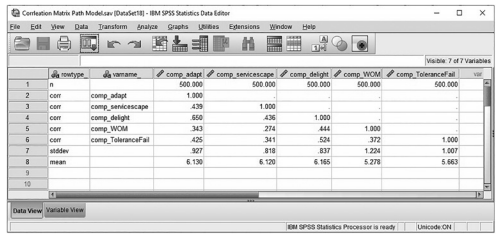
Figure 5.7 Correlation Matrix Used as Input for Path Model
If you so desire, you can also use the covariance matrix as input. See Figure 5.8 for an exam- ple of the specific format needed in SPSS to use the covariance matrix as input.
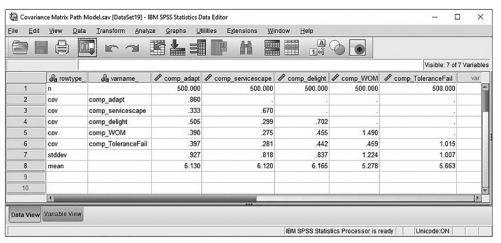
Figure 5.8 Covariance Matrix Used as Input for Path Model
I have included an example that shows the analysis of the path model run with the correlation matrix and another one run with the raw data. The results are near identical. Often, research papers will provide the correlation matrix along with means and standard deviations. If you want to see if a researcher ran the data correctly, you can use that data given as your input and see if the analysis produces similar results to the one provided in the research article.
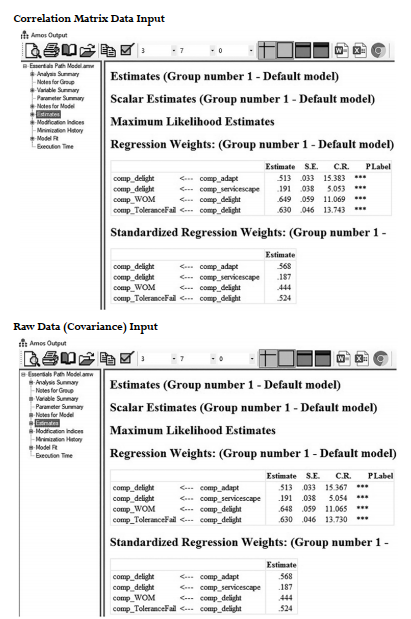
Figure 5.9 Comparison of Covariance and Correlation Matrix Input in AMOS
Notice that in the example, only the composite variables were used and, thus, a path model would be appropriate to use. If you had a full structural model where you wanted to include every indicator in the model test, then you would create a correlation/covariance matrix that included all indicators to be tested in the model.This would be a very large correlation/covar- iance matrix depending on the number of indicators to be included. Regardless of whether it is a composite variable or individual indicators, AMOS will allow you to run the analysis from a correlation or covariance matrix.
If you are looking for an easy way to find the correlation matrix and covariance matrix along with means and standard deviations for each construct, SPSS has numerous options to find this information. One of the best options is to use the correlation analysis function and ask for additional information. To view a correlation matrix in SPSS, you will go to “Analyze” in the top menu, select “Correlate”, and then select “Bivariate”.You will include the variables you want a correlation matrix for and then hit the “Options” button.You can then select the checkbox of “Means and standard deviations”. The next checkbox of “Cross-product devia- tions and covariances” will give you the covariance matrix.
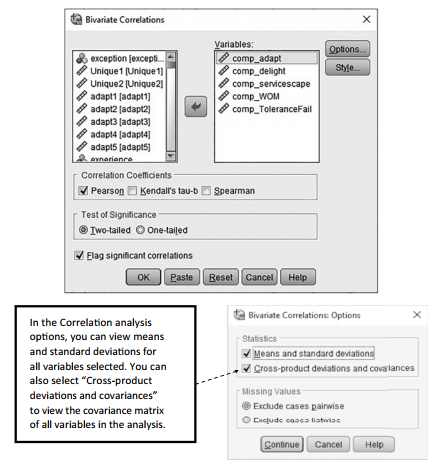
Figure 5.10 Perform Correlation Analysis in SPSS
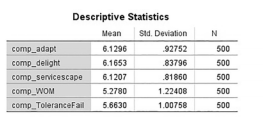
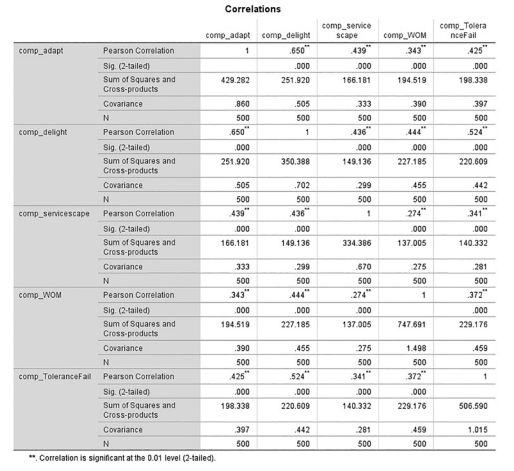
Figure 5.11 Example of Output Using a Correlation Analysis
Source: Thakkar, J.J. (2020). “Procedural Steps in Structural Equation Modelling”. In: Structural Equation Modelling. Studies in Systems, Decision and Control, vol 285. Springer, Singapore.
30 Mar 2023
22 Sep 2022
29 Mar 2023
30 Mar 2023
28 Mar 2023
27 Mar 2023