Traditional approaches to process analysis use established systems analysis and design methods that are part of methodologies such as Structured Systems Analysis and Design Methodology (SSADM), like the data flow diagram technique outlined in Bocij et al. (2005). Such approaches often use a hierarchical method of establishing
- the processes and their constituent sub-processes
- the dependencies between processes
- the inputs (resources) needed by the processes and the outputs.
The processes and sub-processes are essentially the activities or tasks that need to be performed by the business information system, so these are sometime referred to as ‘activity-based process definition methods’. A process can be defined at the business level in terms of the main activities of a business. Each process can be broken down further as explained in the section on Task analysis and task decomposition. Significant business processes are elements of the value chain; they include inbound logistics (including procurement), manufacture, outbound logistics or distribution, and customer relationship management or sales and marketing activity. Davenport (1993) notes that even for large multinational organizations the number of main processes will rarely exceed ten.
Note that in addition to the approaches shown here, use-case analysis to assist in defining interface requirements is described in the Focus on user-centred site design section.
1. Process mapping
Existing business processes often overlap between different functional areas of a business. So, before detailed activities are identified the analyst needs to identify where in the organization processes occur and who is responsible for them. This procedure is often known as ‘process mapping’. Table 11.1 illustrates the activities which occur across functions in a business. Such process mapping is clearly important for identifying potential users of an e-business system. Table 11.1 shows an outline process map that might be used for a B2B company to prepare a proposal for a new major account.
2. Task analysis and task decomposition
Before a process such as ‘prepare proposal’ can be designed and implemented, a more detailed breakdown is required. This is usually referred to as ‘task analysis’.

Noyes and Baber (1999) point out that a difficulty with this type of process or task decomposition is that there are no set rules for what to call the different levels of decomposition or how far to decompose the process. The number of levels and the terminology used for the different levels will vary according to the application you are using and the consultant you may be working with. Georgakoupoulos et al. (1995) talk about ‘task nesting’ of tasks broken down into sub-tasks as part of the activity-based method for describing workflows. They give the example of a workflow process for procurement where the task ‘procure materials’ is broken down further into the sub-tasks of‘verify status’, ‘get bids’ and ‘place order. Curtis et al. (1992) provide a useful framework, referring to process units or elements at each process level as follows:
Level 1 business process are decomposed into:
Level 2 activities which are further divided to:
Level 3 tasks and finally:
Level 4 sub-tasks.
An example of a four-level task decomposition is presented in Figure 11.1.
Attempts to standardize the meanings of these terms have been produced by the Workflow Management Coalition, an industry standards body (WfMC, 1996), which describes the different process elements as follows:

- Business process. A set of one or more linked procedures or activities which collectively realize a business objective or policy goal, normally within the context of an organizational structure defining functional roles and relationships.
- Activity. A description of a piece of work that forms one logical step within a process. An activity may be a manual activity, which does not support computer automation, or a workflow (automated) activity. A workflow activity requires human and/or machine resource(s) to support process execution; where human resource is required an activity is allocated to a workflow participant.
- Work item. The representation of the work to be processed (by a workflow participant) in the context of an activity within a process instance. An activity typically generates one or more work items which together constitute the task to be undertaken by the user (a workflow participant) within this activity.
3. Process dependencies
Process dependencies summarize the order in which activities occur according to the business rules that govern the processes. Normally, activities occur in a sequence and are serial; sometimes activities can occur simultaneously, when they are known as parallel. Data flow diagrams and flow charts are widely used as diagramming techniques to show process dependencies. In this section we will review three techniques for showing dependencies that are more commonly applied in e-business analysis. These are flow process charts and network diagrams including the EPC (event-driven process chain) standard used by the SAP product.
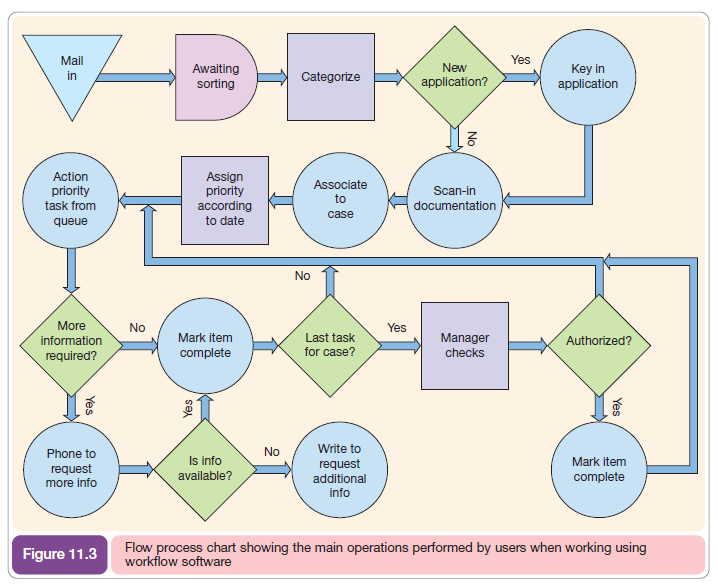
Flow process charts
A simple flow chart is a good starting point for describing the sequence of activities of a workflow that is part of an e-business process. Despite their simplicity, flow charts are effective in that they are easy to understand by non-technical staff and also they highlight bottlenecks and inefficiencies. Flow process charts are used commonly when solving e-business problems, whether in the front office or the back office. Each symbol in the chart refers to a particular operation within the overall process. An explanation of the symbols used in flow process chart analysis is shown in Figure 11.2. Box 11.1 and Figure 11.3 show one way of laying out flow process charts. Another example of how flow process charts are applied in practice using a tabular arrangement is presented in Activity 11.2. An example of how tabular flow process charts can be applied to e-procurement analysis is given in Chapter 7 (p. 385).

Effort duration analysis
Effort duration analysis is an analytical tool that can be used to calculate the overall efficiency of a process when we have performed a detailed analysis such as that in Activity 11.2. To do this, we sum the average time it takes workers to complete every activity making up the overall process, then divide this by the total length of time the whole process takes to occur. The total process time is often much longer since this includes time when the task is not being worked on. Here this is during transport of the forms, and when they are waiting in out-trays and in-trays. The efficiency relationship can be given as:

If we apply effort duration analysis to the first scenario in Activity 11.2, with delays and transport not contributing to the overall process, we can see that the efficiency of this extremely inefficient process is barely 2 per cent! This measure can be extended by noting the activities that add value to the customer rather than simply being administrative.
3.1. Network diagrams
While data flow diagrams and flow process charts may give a good indication of the sequence in which activities and tasks occur, they often do not give a sufficiently tight, formal definition of the process sequence necessary for input into an e-business, workflow or ERP system. To do this we can use a network diagram known as a GAN (generalized activity network). Here, nodes are added between the boxes representing the tasks, to define precisely the alternatives that exist following completion of a task. The most common situation is that one activity must follow another, for example a check on customer identity must be followed by a credit check. Where alternatives exist, the logic is defined at the node as follows: where a single pathway is taken from two or more alternatives, the node is defined as an OR node, and when several pathways may be followed this is an AND node. Join nodes combine previous activities, and splits determine which activities occur next. Where there are alternatives, business rules are defined as pre-conditions or post-conditions. A summary of the alternative dependencies is given in Table 11.4.
3.2. Event-driven process chain (EPC) model
One of the most widely used methods for describing business events and processes is the event-driven process chain method (EPC). This has been popularized by its application to re-engineering of enterprises performed using the SAP R/3 ERP product which accounts for worldwide sales of several billion dollars. Over 800 standard business EPCs are defined to support the SAP R/3 system; they are intended to illustrate business rules clearly for interpretation by business users before enactment in the software. The different elements of the EPC model are shown in Table 11.5; these include the different types of dependencies previously reviewed in Table 11.4. Figure 11.4 is an EPC meta-model illustrating how the different elements relate to one another. This figure shows how business functions are triggered through transactions on business objects which also lead to a business event. Control flows link the activities, events and logical operators. Entities or information objects are items such as sales orders or invoices.
4. Validating a new process model
Whichever method has been used to arrive at the process definition, we need to check that the process definition is realistic. When developing a wish list of process capabilities and corresponding business rules the stages described by David Taylor in his book on concurrent engineering (Taylor, 1995) may be useful. He suggests that once new processes have been established they are sanity checked by performing a ‘talk-through, walk-through and run- through’. Here, the design team will describe the proposed business process as a model in which different business objects interact and in the talk-through stage will run through different business scenarios using cards to describe the objects and the services they provide to other business objects. Once the model has been adjusted, the walk-through stage involves more detail in the scenario and the design team will role-play the services the objects provide. The final run-through stage is a quality check in which no on-the-spot debugging occurs – just the interactions between the objects are described. Increasing use is made of simulation software to model alternative scenarios.
Source: Dave Chaffey (2010), E-Business and E-Commerce Management: Strategy, Implementation and Practice, Prentice Hall (4th Edition).
Hello, you used to write excellent, but the last few posts have been kinda boringK I miss your great writings. Past several posts are just a little out of track! come on!
As soon as I noticed this website I went on reddit to share some of the love with them.