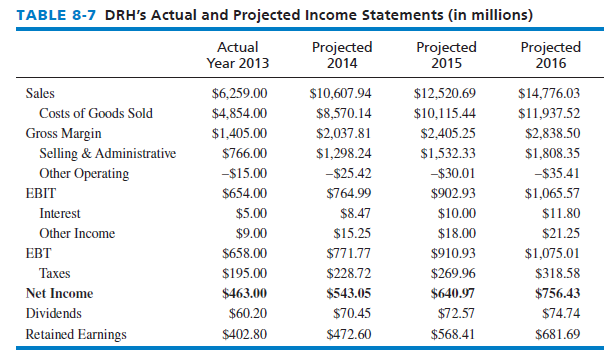
Because so many strategic management students have limited experience developing projected financial statements, let us apply the steps outlined on the previous pages to the largest American homebuilder company by revenues, D. R. Horton (DRH). The projected statements, developed on January 14, 2014, considered that D.R. Horton would go forward with the following four recommendations in 2014-2016, and incur the following expected costs:
- Acquire four building products firms: (a) Universal Forest Products, (b) Scotch and Gulf Lumber, (c) United Plywood and Lumber, and (d) Dixie Plywood. Total Cost = $850 million
- Expand home-building services to North and South Dakota to gain 5% of the market by the end of 2016. (Start with an office in Bismarck, ND, the second-largest city in ND. It is close enough to the ND/SD border to serve both states, and it is located where Bismarck and Minneapolis can both help serve Fargo/Moorhead. If all goes well, place a second location in Rapid City, SD, the second-largest city in SD. It is located where Rapid City and Minneapolis can both help serve Sioux Falls, and is located close enough to Casper, WY, and Scottsbluff, NE, for possible future service expansions.) Total Cost = $232 million
- Increase the number of communities that DRH services by 50% in California and Nevada by 2016 (20 more communities in California and 10 more communities in Nevada). Total Cost = $290 million
- Develop and launch a nationwide marketing campaign. Topics should include
- R. Horton’s low prices in the industry (while still stressing they provide value), home owning is still more cost effective than renting, green solutions offered by DRH, corporate social responsibility efforts by DRH, and targeting the 55 to 75 age group for buying homes. Total Cost = $35 million

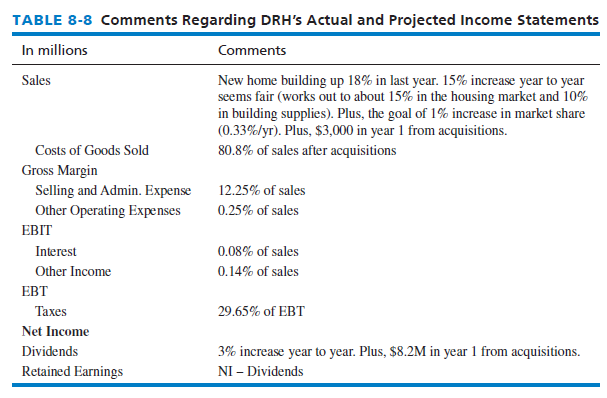
Based on these recommendations, DHR’s actual and projected income statements are given in Table 8-7. Note the large increase in sales in 2014 were due to DRH potentially acquiring four smaller homebuilder companies. Note also at the bottom of Table 8-7 the dividends to be paid and resultant annual retained earnings to be carried forward to the DRH projected balance sheets. Commentary regarding DRH’s actual and projected income statements is provided in Table 8-8.
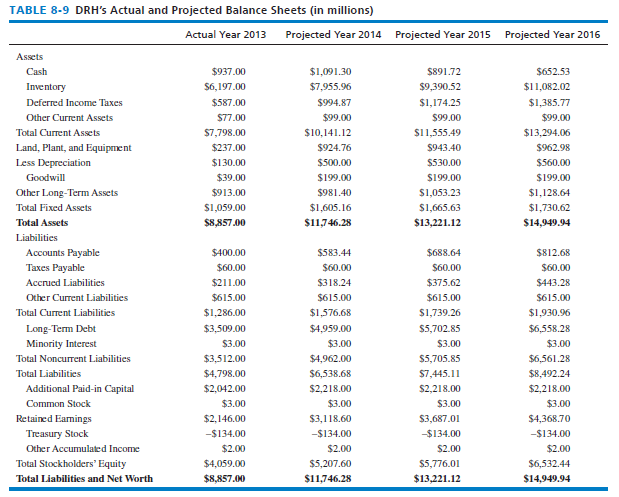
Table 8-9 reveals DRH’s actual and projected balance sheets given the four recommendations listed earlier and the annual retained earnings carried forward to the balance sheet. Table 8-10 provides commentary regarding the projected balance sheet changes.
Note in Table 8-9 that DRH increased its retained earnings on the projected balance sheets correctly, expecting to pay out the dividend amounts indicated in Table 8-8. Note in Table 8-9 that the projections show DRH not buying back any of its own stock (treasury stock), as indicated by the $134 number staying unchanged. Many companies lately have been aggressively buying their own stock, reflecting optimism about their future. However, some analysts argue that stock buybacks eat cash that a firm could better use to grow the firm. Stock buybacks do however reduce a firm’s number of shares outstanding, which increases a firm’s EPS, so firms reap this “intangible benefit” with stock buybacks. Sometimes firms will thus increase their treasury stock near the end of the quarter, or near the end of the year, to “artificially” inflate their EPS, which oftentimes makes the stock price go up. For example, FedEx bought $2.8 billion worth of its own stock in its 2014 fiscal fourth quarter, contributing 15 cents to the company’s EPS of $2.10, thus beating Wall Street’s expectation of $1.95. In fact, 25 percent of the S&P 500 companies in the third quarter of 2014 alone increased their EPS by 4 percent or more simply by buying back their own stock.


Source: David Fred, David Forest (2016), Strategic Management: A Competitive Advantage Approach, Concepts and Cases, Pearson (16th Edition).

It’s hard to find knowledgeable people on this topic, but you sound like you know what you’re talking about! Thanks