In SPSS, Split File is used to run statistical analyses on subsets of data without separating your data into two different files.
1. Grouping or Splitting Data
When analyzing data, it is sometimes useful to temporarily “group” or “split” your data in order to compare results across different subsets. This can be useful when you want to compare frequency distributions or descriptive statistics with respect to the categories of some variable (e.g., Gender) – especially if you want separate tables of results for each group.
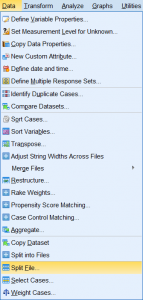
To split your dataset, click Data > Split File.
SPSS Version 25 Drop-Down Menu
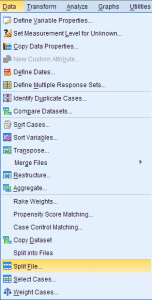
SPSS Version 22 Drop-Down Menu
The Split File window will appear. By default, the dataset is not split according to any criteria; this is indicated by Analyze all cases, do not create groups.
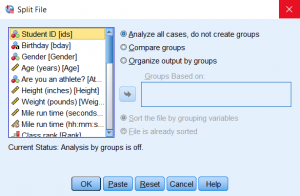
You can choose one of two ways to split the data:
- Compare groups
- Organize output by groups
For both splitting methods, there are two considerations to be made:
- The splitting variable(s) should be nominal or ordinal categorical. SPSS will not stop you from using a continuous variable as a splitting variable, but it is a bad idea to try to attempt this; SPSS will see each unique numeric value as a distinct category.
- In order to split the file, SPSS requires that the data be sorted with respect to the splitting variable. By default, Sort the file by grouping variables is selected.
2. Turning Off Split File
When you no longer want to split your analyses by group, you can turn Split File off through the same window you used to turn it on.
- Click Data > Split File.
- Click Analyze all cases, do not create groups.
- Click OK.
You can now run all analyses normally again.
Syntax
SPLIT FILE OFF.Example
What are the differences in the split file options?
The Compare and Organize options produce numerically identical results when the same grouping variable(s) are applied. This is true regardless of what statistical analysis is used. The difference between the two options is how the numeric results are presented.
- If Compare groups is used, then all of the results will be shown in a single table. The table will have sections showing the results for each group.
- If Organize output by groups is used, then each groups’ results will be put into a separate table.
The choice of which splitting method to use is entirely about what format the user wants their results in. Do you want a single table with all results, or separate tables for each group’s results? A good rule of thumb is to choose Compare Groups if you want to be able to directly compare the results of your groups, and to choose Organize Output by Groups if the information is from separate trials or samples (such as cohorts from different years).
Problem Statement
Suppose that we want to get a summary of the differences in height between males and females in the sample data. Let’s couple the Split File procedure with the Descriptives procedure to get summary statistics for the two groups. We’ll use both Split File methods so that we can compare what their outputs look like.
Splitting using Compare Groups
If you choose to split your data using the Compare groups option and then run a statistical analysis in SPSS, your output will be displayed in a single table that organizes the results according to the grouping variable(s) you specified.
Running the Procedure
To split the data in a way that will facilitate group comparisons:
- Click Data > Split File.
- Select the option Compare groups.
- Double-click the variable Gender to move it to the Groups Based on field.
- When you are finished, click OK.
After splitting the file, the only change you will see in the Data View is that data will be sorted in ascending order by the grouping variable(s) you selected.
Now let’s view the aforementioned descriptive statistics for the variable Height with respect to Gender. Select Analyze > Descriptive Statistics > Descriptives. Double click on the Height variable, then click OK.
Syntax
SORT CASES  BY Gender.

SPLIT FILE LAYERED BY Gender.

DESCRIPTIVES VARIABLES=Height
  /STATISTICS=MEAN STDDEV MIN MAX.
Output

This table gives us a breakdown of how many observations were in each group (N), and the minimum, maximum, average, and standard deviation of each group. The ‘.’ group contains cases with missing gender values and nonmissing height values. At a glance, we can quickly take note that in this sample:
- The height of the tallest male was greater than the height of the tallest female.
- The male heights tended to have a slightly larger standard deviation (spread) than the female heights.
- On average, the males were taller than the females.
- The individuals with missing values for gender had a much smaller range of heights than did the males or females.
Note: This combination of Split File: Compare Groups with Descriptives is very similar to what you would get with the Compare Means procedure. The major difference is that Split File includes the missing values in the grouping/splitting variable, whereas Compare Means excludes missing values in the grouping variable.
Splitting using Organize Output by Groups
If you choose to split your data using the Organize output by groups option and then run a statistical analysis in SPSS, your output will be broken into separate tables for each category of the grouping variable(s) specified.
Running the Procedure
To split the data in a way that separates the output for each group:
- Click Data > Split File.
- Select the option Organize output by groups.
- Double-click the variable Gender to move it to the Groups Based on field.
- When you are finished, click OK.
After splitting the file, the only change you will see in the Data View is that data will be sorted in ascending order by the grouping variable(s) you selected.
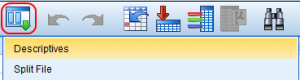
Now we will re-run the same descriptive statistics procedure that we ran before. You can go through the menu system again (Analyze > Descriptive Statistics > Descriptives), or you can click on the Recall recently used dialogs icon, which will bring up a list of recently used procedures:
Syntax
SORT CASES BY Gender.
SPLIT FILE SEPARATE BY Gender.
DESCRIPTIVES VARIABLES=Height
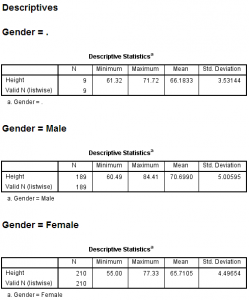
/STATISTICS=MEAN STDDEV MIN MAX.Output
After re-running the descriptive statistics, we see that the output is broken into three sections based on values of the Gender variable. The first section (“Gender = .”) reports the minimum, maximum, average, and standard deviation of Height for the students who had missing values for Gender. The second section reports those same statistics for the male students; the third section reports the statistics for the females.
14 Sep 2022
27 Mar 2023
16 Sep 2022
19 Sep 2022
27 Mar 2023
30 Mar 2023