One of the great contributions to the concept of trend and direction is the concept of directional movement that Welles Wilder (1978) developed in his book New Concepts in Technical Trading Systems. Wilder compared a stock’s trading range for one day with the trading range on the previous day to measure trend. Positive directional movement occurred when the high for a day exceeded the high of the previous day. As shown in Figure 14.7, the amount of positive directional movement (+DM) is the day’s high minus the previous day’s high, or the vertical distance between the top of the two bars. If the low for the day is less than the previous day’s low, negative directional movement occurs. The value of the negative directional movement (-DM) is the difference between the two lows.
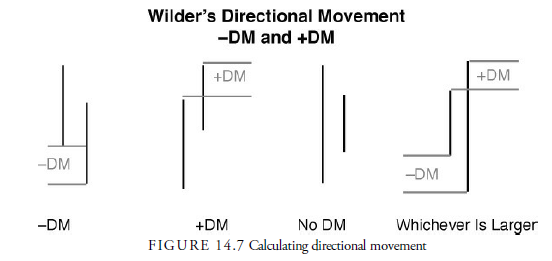
Days on which the range is completely within the previous day’s range are ignored, and a zero is given to the range excess. In addition, one day’s trading range is sometimes much larger than the previous day’s trading range. This can result in both a higher high and a lower low. When this happens, the greater difference wins. In other words, only a +DM or -DM may be recorded for a particular day.
1. Constructing Directional Movement Indicators
A moving average is calculated for both +DM and -DM, usually over 14 days, using the Wilder method of averaging. In addition, a 14-day average trading range (ATR) is calculated. Two indicators are calculated using this data. The positive directional movement indicator (DI+) is the ratio between the smoothed +DM and the TR; this calculation gives the percentage of the true range that was above equilibrium for those 14 days. The second indicator is the negative directional movement indicator (DI-), which is calculated as the ratio between the smoothed -DM and the ATR.
2. Using Directional Movement Indicators
Figure 14.8 shows 14-day DIs for Walmart (WMT). Looking at this chart, an analyst sees a number of hints about trend. First, when one DI is higher than the other, the trend is in the direction of that DI. For example, from early November through late January, the DI+ was above the DI-, indicating that a majority of the 14-day ATR excess for WMT was on the upside during that period. The first major crossover occurred in early October when the DI+ crossed above the DI- (marked with “X1”) indicating an upturn in the price trend, and the second occurred in late January when the DI- crossed above the DI+ (marked with “X2”) and warned us that the trend had reversed downward. This confirmed the earlier downward break of the trend line. Thus, the DMI crossover is an important signal in analyzing trends.
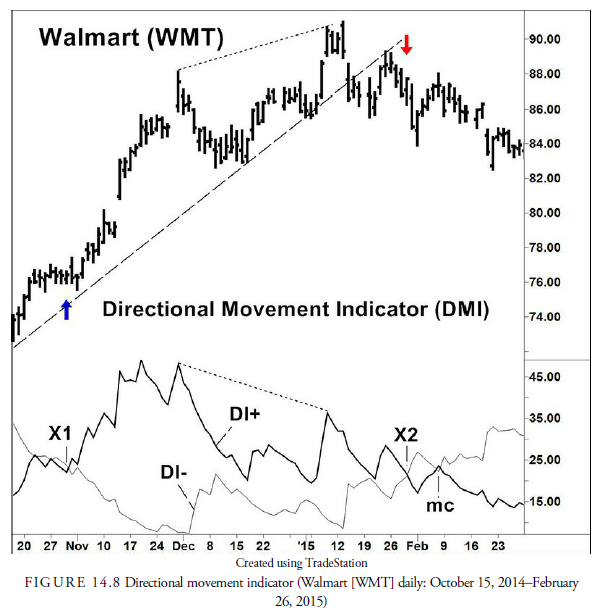
Second, the minor crossover that occurred in early February (marked with a “mc”) and lasted only a day is an important sign. It suggests that the direction of the trend is now sideways and, like a congestion area, it may break in either direction. Often, the two DIs come to equilibrium and then part in their original direction, as happened here, in which case the earlier trend resumes. At other times, the DIs cross more dramatically and incisively, as they did in late January, and signal a trend reversal. When the two meet, therefore, is an important period. Wilder suggested placing a buy or sell stop at the price when the two first cross. In Figure 14.8, as the two DIs cross in early February, we do not know if this is a trend reversal. Thus, we place a buy stop at a price just above the price that occurred when the two initially crossed. If the trend is reversing, the price will hit our stop, and our position will be in line with the new upward trend. If the stop is not hit, the two lines will likely diverge again, and the old downward trend will continue without us.
Third, standard divergence techniques are valid in the DMI. In Figure 14.8, notice where the highest peak exceeded the earlier peak (price plot: dotted line from peak to peak) was not confirmed in the DI+, which failed to reach a new high at the same time (DMI plot: dotted line from peak to peak). This is a negative divergence that, although not an action signal, is a warning that the earlier upward trend is losing strength.
Fourth, the DIs can be used to create a directional index (DX). This DX then is used to create the average DX called the ADX line shown in Figure 14.9. The DX is calculated by taking the absolute difference between the values of the two DIs and dividing it by the sum of the two DIs. The DX is always positive and represents the tendency of the market to trend because it measures the DIs against each other. When one DI is very large compared to the other DI, the market is moving strongly in one direction and the value of the DX will be large.
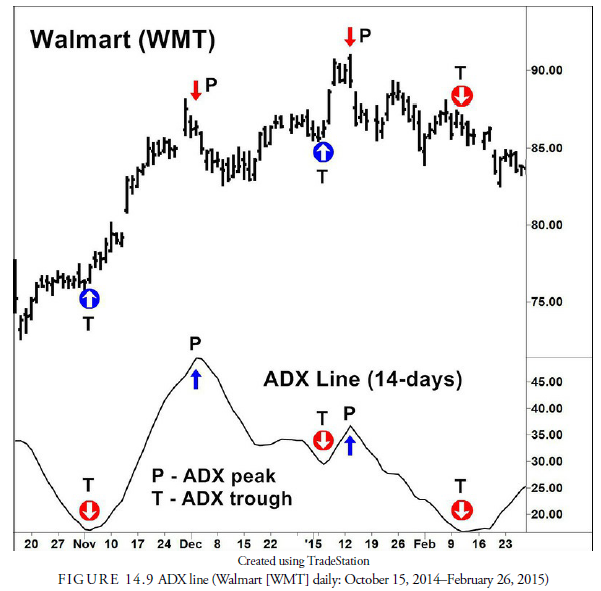
The ADX is the smoothed value of the DX and is plotted on Figure 14.9. When the ADX is rising, the market is increasingly trending in either direction.
The ADX indicator is valuable in determining when to apply a moving average trend-following system. A rising ADX indicates an increasing tendency to trend in the corresponding prices. A low ADX or one that’s declining indicates a flat or dull trend on one that is losing momentum. We know that the moving average crossover systems have multiple whipsaws when the market is not in a directional trend but have profitable outcomes when the market is trending in either an upward or a downward direction. Many trend-following models use the ADX to determine when money should be committed to the markets.
Fifth, ADX peaks and troughs provide valuable information about the price trend. When the ADX peaks, it often signals a peak or trough in prices. In Figure 14.9, peaks in the ADX (marked with arrows) show how closely they coincide with up or down reversals in price. Because their pinpointing the end of trends is so accurate, ADX peaks are used as trading signals to close trend positions.
Troughs in the ADX are useful because they signify periods when the market has become dormant and trendless but is beginning to accelerate in a trend direction. When the ADX begins to rise, not necessarily from a low level, it signals a sudden increase in trending and is a time to look for entry into the trend. As we know from looking at congestion areas, a dormant period is usually followed by a dynamic period. This phenomenon can be seen in Figure 14.9 with the ADX troughs (marked with arrows within circles) associated with the dormant period turning into a trend with increasing momentum. When an ADX trough occurs, the trader or investor should be watching price closely for a breakout in either direction.
ADXs and DMIs can be used on weekly, monthly, and even shorter-term, intraday charts for clues as to trend strength and direction.
Source: Kirkpatrick II Charles D., Dahlquist Julie R. (2015), Technical Analysis: The Complete Resource for Financial Market Technicians, FT Press; 3rd edition.
Rattling instructive and good anatomical structure of subject material, now that’s user genial (:.