Factor scores are linear composites, formed by standardizing each variable to zero mean and unit variance, and then weighting with factor score coefficients and summing for each factor. predict performs these calculations automatically, using the most recent rotate or factor results. In the predict command we supply names for the new variables, such as f1 and f2.

Being standardized variables, the new factor scores f1 andf2 have means (approximately) equal to 0 and standard deviations equal to 1:

Thus, the factor scores are measured in units of standard deviations from their means. Mercury, for example, is about .92 standard deviations below average on the large size/many satellites f1) dimension because it is small and has no satellites. Mercury is 1.26 standard deviations below average on the far out/low density (f2) dimension because it is close to the sun and high density. Saturn, in contrast, is 1.18 and .93 standard deviations above average on these two dimensions.
Promax rotation permits correlations between factor scores:
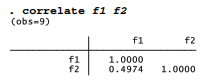
Scores on factor 1 have a moderate positive correlation with scores on factor 2. That is, far out/low density planets are more likely to be larger, with many satellites.
Another post-factor-analysis graphing command, scoreplot, draws a scatterplot of the observations’ factor scores. Used with principal component factors, such graphs can help to identify multivariate outliers, or clusters of observations that stand apart from the rest. Figure 11.3 reveals three distinct types of planets.

The inner, rocky planets (such as Mercury, low on “large size/many satellites” factor 1; low also on “far out/low density” factor 2) cluster together at the lower left. The outer gas giants have opposite characteristics, and cluster together at the upper right. Pluto, which physically resembles some outer-system moons, is unique among the nine classical planets for being high on the “far out/low density” dimension, and at the same time low on the “large size/many satellites” dimension. Our factor analysis thus identifies Pluto as a different kind of object that does not fit with either of the two main group of planets. Recognizing Pluto’s exceptionalism, the International Astronomical Union voted in 2006 to reclassify it from being a true planet to one of the dozens of known “dwarf planets,” leaving us with only eight true planets.
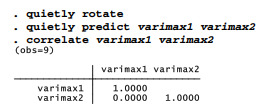
If we employ varimax instead of promax rotation, we get uncorrelated factor scores:
Once created by predict, factor scores can be treated like any other Stata variable — listed, correlated, graphed and so forth. Factor scores often are used in social and behavioral science to combine many test or questionnaire items into composite variables or indexes, as illustrated later in this chapter. In physical-science fields such as climatology or remote sensing, factor scores obtained by principal components without rotation help to analyze large datasets. In these applications, principal components are called “empirical orthogonal functions.” The first empirical orthogonal function, or EOF1, equals the factor score for the first unrotated principal component. EOF2 is the score for the second principal component, and so forth.
Source: Hamilton Lawrence C. (2012), Statistics with STATA: Version 12, Cengage Learning; 8th edition.
28 Sep 2022
23 Sep 2022
3 Oct 2022
3 Oct 2022
28 Sep 2022
29 Sep 2022