Leaving colder regions behind, the remainder of this chapter works with the United Nations human development data in Nations3.dta. Nonlinear relationships among variables are prominent in scatterplots of these data, such as that in Figure 7.4. Logarithms and other transformations from Tukey’s ladder of powers (Chapter 5) provide simple tools for making nonlinear relationships more linear, enabling the application of OLS, robust regression or other linear models.
Selecting which transformation to use might involve trying out several choices, and examining how each affects distributions, scatterplots or residuals. A more systematic approach called Box-Cox regression instead uses maximum likelihood estimation to select Box-Cox transformation parameters that are optimal for a particular regression model. The common Box-Cox transformation is applied to all variables in the model, or any subset of them.
Consider the regression of life expectancy on six other variables including regl, a dummy variable created by tabulate, which indicates nations in Africa.
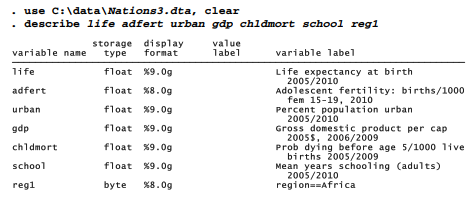
There is no point in transforming a dichotomous variable like regl, but scatterplots of the other variables show nonlinear patterns that make them candidates for transformation. In this example we regress life on adfert, urban, gdp, chldmort, school and regl. The dependent or left-hand- side variable life is left in raw form, but a transformation is sought for all of the right-hand side variables except regl. These choices are specified by options model(rhsonly) notrans(reg7). Note that initial variable list does not include regl, because it is specified separately in the notrans() option.

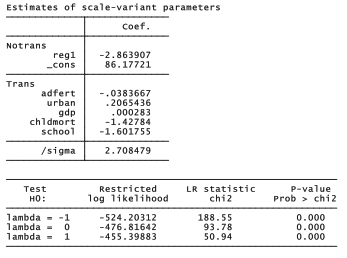
The lambda value given in this output, λ = .4867359, is the parameter chosen for Box-Cox transformations of the general form
![]()
The regression coefficients shown in the Box-Cox output above correspond to an ordinary regression with variables transformed in this fashion. We could replicate the Box-Cox regression results by generating transformed versions of each variable, then using regress.

Box-Cox regression finds a transformation parameter A that is optimal in terms of a maximum- likelihood criterion. Meeting this criterion does not necessarily mean that relationships have been linearized, however. The latter goal might still be more effectively pursued using judgment and visual inspection, with the possibility of different transformations for different variables.
Source: Hamilton Lawrence C. (2012), Statistics with STATA: Version 12, Cengage Learning; 8th edition.
23 Sep 2022
3 Oct 2022
26 Sep 2022
29 Sep 2022
29 Sep 2022
1 Oct 2022