Responses are measured using four types of data:
- nominal;
- ordinal;
- interval;
- ratio.
These are frequently described as ‘measurement scales’, though most researchers would not necessarily recognize all of them as scales. It is important for the questionnaire writer to recognize which type of data is being collected for each question, as this will determine the type of analysis that can be carried out.
1. Nominal data
Nominal data are data that are classified into discrete categories by name, eg male, female; New York, Chicago, Los Angeles; purchaser of pizza, non-purchaser of pizza. Depending on the type of data collection system used, a number will often be assigned to each category. However, that number is purely arbitrary and implies no value that can be given to the response category. The numbers are given for identification purposes only. Thus if a sampling point is described as ‘Urban’ and is given a code of 1, and ‘Rural’ is assigned a code 2, there is no relative value implied between the two categories (see Figure 4.3). Respondents are classified into one category or another. The categories should be exhaustive (ie everybody should fit somewhere) and mutually exclusive (ie there is no overlap between them).
The responses are usually presented in an order that is the most convenient for the respondent, which may be alphabetically, or by size, or by geography.
Nothing can be done with the data except to count the number of responses against each code. It is meaningless to calculate an average across the responses or to carry out any other calculation based on the value of the code.

2. Ordinal data
Ordinal data are usually found in questionnaires as ranking scales, otherwise known as ‘comparative scales’. Respondents are asked to put nominal categories in order according to a criterion contained in the question. This is often order of preference, as in:
Please put the following flavours of yoghurt in the order in which you prefer them, starting with 1 for your first choice through to 5 for your least preferred:
Blackcurrant 3
Black cherry 1
Peach 4
Raspberry 5
Strawberry 2
Other ranking questions might include ranking by order of:
- a product characteristic – sweetness, consistency, strength;
- frequency of use – most used, next most used, etc;
- recency of use – last used, next to last used, etc;
- perceived price – most expensive to least expensive;
- ease of comprehension – easiest to understand to most difficult.
Ranking puts the nominal data into the appropriate order, but tells the researcher nothing about the distance between the points. In the example above, strawberry yoghurt might be liked almost as well as black cherry, with both of them liked considerably more than blackcurrant. The researcher cannot deduce this from the data. Nor can the researcher determine whether the last choice, raspberry, is actively disliked and would never be chosen by this respondent, or whether it is firmly in the repertoire of flavours. It may even be the case that the respondent actually likes none of these five flavours and the ranking is based on which flavours are least disliked.
Ranking can be used to force differences between brands, products or services, which would not be apparent with rating scales. On a five-point rating scale of sweetness, from not at all sweet to very sweet, the five flavours of yoghurt may all be rated fairly or very sweet, giving the researcher insufficient discrimination in the resulting data. By using ranking, that discrimination is forced out.
The task of ranking can become too difficult for respondents where there are a large number of items.
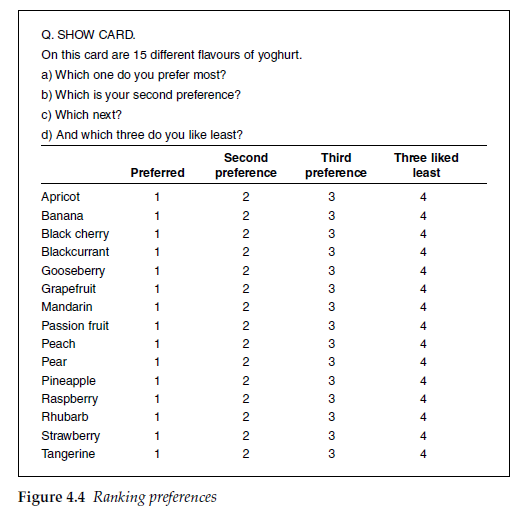
Suppose that we want to ask respondents to give their order of preference for, say, 15 flavours of yogurt. With electronic self-completion interviews, either web-based or CAPI, this is relatively straightforward, as respondents can be asked to drag and drop the flavour descriptions into their rank order of preference.
With interviewer-administered and paper questionnaires the task is rather more onerous. Ranking 15 flavours of yoghurt would be a tedious exercise. Even if they could do it, for many people it would be unrealistic, as they may have a number that they like and a number that they dislike, but have some in between that they have no feelings about. The length of the task and its unrealistic nature would be likely to lead to fatigue, with a consequent lack of care given to the responses. There may be a knock-on effect to the rest of the interview, damaging the quality of the responses thereafter. This problem can be approached in a number of ways.
Respondents can be asked to rank their preferred flavours up to a predetermined number and their least preferred, or those that they don’t like at all, if this is more appropriate. Or, as in Figure 4.4, they may be asked to rank their preferred three and then to nominate their least preferred three, but with no order recorded for the least preferred.
In a face-to-face interview, each flavour can be presented on a card. Respondents are asked to put their five preferred flavours (or the five sweetest flavours, or whatever is appropriate to the question) in one pile, and the five least preferred (or least sweet) in a second pile. They are then asked to rank-order the cards in each pile, from preferred to least preferred, or sweetest to least sweet. There is rarely difficulty ranking the top five, as the respondent is likely to have a reasonably clear view about them. However, the bottom five can often present difficulties to respondents in discriminating between them as they are all rejected, and equally so. The number of items in the bottom group should be carefully thought about and different options piloted wherever possible, in order to find what is a sensible number to ask about. This type of exercise then gives a notional rank order equal to the mid-point for all of the items not ranked in the top or bottom five. This is not unrealistic, as respondents will often know what they like and what they dislike, and have a group of items in between about which they have no strong views.
3. Interval scales
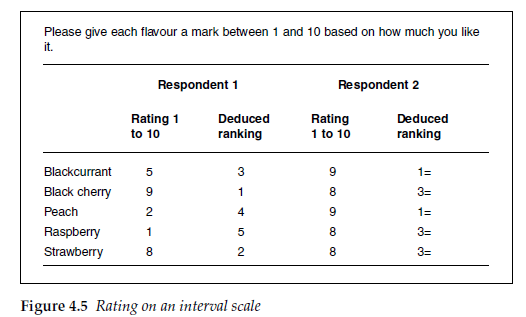
Interval scales provide for a rating of each item on a scale that has a numerically equal distance between each point, and an arbitrary, and therefore meaningless, zero point. Such scales are used in order to determine the relative strength of relationships between items. The five flavours of yoghurt could be individually rated on a scale from 1 to 10 for how much each is liked. There is an equal interval between each point, but a score of 8 does not necessarily mean that the item is preferred twice
as much as another item scored 4. The advantage of the interval scale over the ordinal scale is that the researcher can tell whether an item is liked or disliked (or thought to be sweet or not, etc) by its rating. It will, however, not always be possible to assign a rank order for the items from this information.
Figure 4.5 gives the results for two respondents asked to rate the five yoghurt flavours on a 10-point interval scale. The first respondent has given a different score to each flavour, so that not only can we rank-order that person’s preferences, but we can now tell that the person likes black cherry and strawberry rather better than blackcurrant, whilst peach and raspberry are not liked. The second respondent, however, likes all five flavours and it is difficult to deduce a meaningful rank order of preference from the interval scale responses.
In practice, the researcher is rarely dealing with data at an individual level but with aggregated data over the whole sample. Interval scales allow mean scores and standard deviations to be calculated across the sample for each item. Using mean scores can often appear to overcome this, as over a large sample it is rare for the mean score for two items to be identical. The analyst, though, must be careful that any two mean scores are significantly different with a desired level of confidence before concluding that across the sample one item is rated differently to another.
The distribution of the data across the scale should also be examined as the same mean score can be produced by very different distributions.
Many of the scales used in measuring attitude, brand perceptions, customer satisfaction, etc are interval scales. These include the semantic differential scale, Likert scale and others covered in Chapter 5.
4. Ratio scales
Ratio scales are a particular type of interval scale. The zero point has a real meaning, such that the ratio between any two scores also has a meaning. Age is a ratio scale, with a 50-year-old person being twice as old as a 25-year-old. Income is another.
This type of scale is also used to ask questions such as:
- ‘Out of the last 10 cans of baked beans that you bought, how many were Heinz?’
- ‘What proportion of your household income do you spend on your rent or mortgage?’
- ‘How long ago did you buy your car?’
In some instances we might choose to record the responses directly and sometimes within categories. For these three questions the recording of the responses may be as in Figure 4.6.
Note that the response categories are not necessarily of equal length. These have been chosen to suit the purposes of the researcher or to reflect the expected distribution of the data. The proportion of income spent on rent or mortgage could have been recorded as a direct percentage and categorized at the analysis stage. The reason for putting this into bands is that most respondents will not know the answer to the exact percentage point, and if they are asked for it, this could lead to a higher level of nonresponse at this question. The length of time since respondents bought their car could be recorded as days, months or years. No one would bother to work out the number of days, however, and only the most recent buyers would easily be able to give the time in months. The researcher here is particularly interested in differences between people who have bought their car relatively recently, so it is important to be able to distinguish between very recent purchasers (within the last three months) and less recent purchasers.
Be aware, though, that changing the scale can alter the way in which people respond. Dillman (2000) quotes an example where responses in the same category changed from 23 per cent to 69 per cent when that category changed from being the highest response to being the lowest response on a time-based ratio scale. The category options facing most question writers will rarely be so great as to result in this scale of difference, but this emphasizes the importance of making the scale appropriate to the anticipated distribution of answers.
The fact that the recording of the data is categorized does not affect the underlying property that there is a relationship between the responses, and the researcher can identify a respondent who buys twice as many cans of Heinz beans, or spends twice as much on rent or mortgage, or bought a car twice as long ago as another. The accuracy of this calculation is restricted only by the size of the categories used to collect the data.

With allocation of appropriate scores to each point, or average values to each range, we can now calculate mean values and standard deviations for the sample, and carry out statistical tests.
Source: Brace Ian (2018), Questionnaire Design: How to Plan, Structure and Write Survey Material for Effective Market Research, Kogan Page; 4th edition.
20 Aug 2021
20 Aug 2021
23 Oct 2019
20 Aug 2021
20 Aug 2021
20 Aug 2021