A full structural model assesses the relationships between constructs but also includes the measurement indicators for each variable. A full structural model will allow you to account for the measurement error in a construct’s indicators while also assessing the relationships between constructs.You will initially draw all the constructs and indicators like you did in the CFA, then you will start including the direct paths between constructs. This is a more robust model and will account for each indicator individually. Unlike a composite vari- able path model, each indicator of a construct is included along with its effect on other constructs.
Let’s go back to the path model example and look at it as a full structural model. With the full structural model, the unobserved constructs and indicators are modeled along with the relationships between constructs. See Figure 5.12.
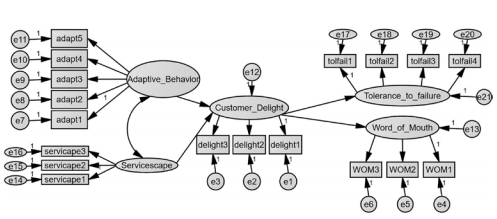
Figure 5.12 Full Structural Model Drawn in AMOS
Just like in the path model, you need to include error terms for each dependent con- struct and to make sure all error terms are labeled. In the CFA, all constructs were considered independent constructs, but that is not the case in a full structural model. A construct is considered an independent if it has a structural relationship that influences another construct and is not being influenced by any other construct in the model. In this example, Adaptive Behavior and Servicescape are the only independent variables. Since these two constructs are considered independent, a covariance needs to be added between them.
After adding the structural relationships and labeling all error terms, you are ready to run the analysis. A full structural analysis will give you not only the structural rela- tionships between constructs but also the measurement properties or factor loadings for each construct. With a full structural model, the degrees of freedom will be substantially higher, which should alleviate any model fit inflation that happens when a model is close to just-identified. Let’s take a closer look at the output of this full structural model test; see Figure 5.13.
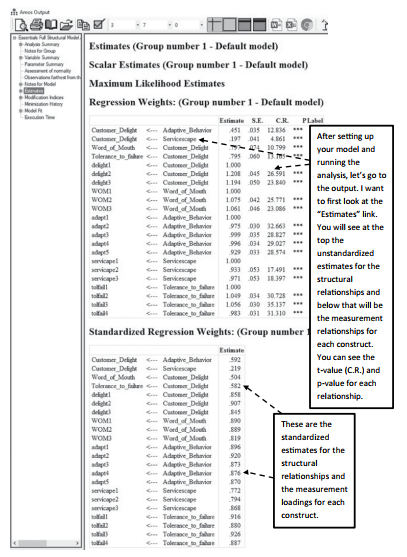
Figure 5.13 Estimates Output for Full Structural Model
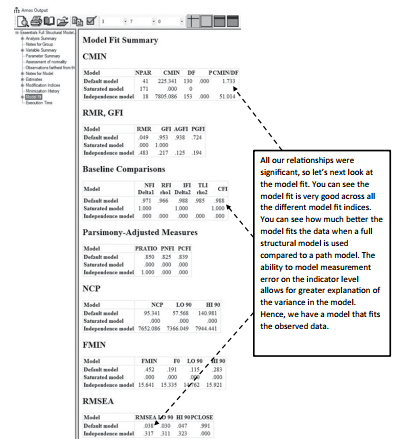
Figure 5.14 Model Fit Statistics for Full Structural Model
Next, let’s look at the modification indices.With the full structural model, we should have already assessed the measurement model when we performed a CFA; thus, our focus is not on adjusting/covarying error terms with constructs. At this point, the modifications that concern us are the regression weights between constructs. As you can see, there are no modifications that are substantial or worthy of consideration (See Figure 5.15).The modification indices will suggest unacceptable alterations such as indicators having structural relationships with other indicators. Even if the modification index is high, these are nonsensical suggestions and should not be considered.
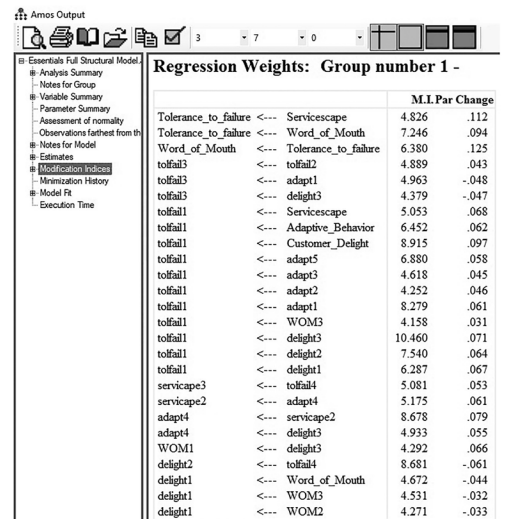
Figure 5.15 Modification Indices for Full Structural Model
The overall results of the full structural model show that the relationships from Adaptive Behavior and Servicescape to Customer Delight were significant. Additionally, the relation- ships from Customer Delight to PositiveWord of Mouth and Tolerance to Future Failures were also significant. If you compare the results from the path model to the full structural model, you will see that all the structural relationships are stronger in the full structural model, and this is a function of explaining more of the variance in the model with the indicators included. This is also reflected with the stronger model fit indices for the full structural model over the path model. Overall, a full structural model will provide a stronger test in assessing relation- ships between constructs than using a path model.
One function not yet discussed is the “View Output Path Diagram” function. After you run your analysis, you can go back to the graphics window and view the standardized or unstand- ardized results for every path on the actual diagram. The view output path diagram function is what will display these values on the model.This function is located at the top of the graph-
ics window right above the “Groups” window. The graphic interface looks like this: ![]() . It is represented with an arrow pointed up.You have to run the analysis first, but then you can click this button and it will give you the regression coefficients for each parameter. It will not give you significance of a parameter; just the regression value. If you want the values to go away, just hit the input path diagram button, which is the part of this interface with the arrow pointed down.
. It is represented with an arrow pointed up.You have to run the analysis first, but then you can click this button and it will give you the regression coefficients for each parameter. It will not give you significance of a parameter; just the regression value. If you want the values to go away, just hit the input path diagram button, which is the part of this interface with the arrow pointed down.
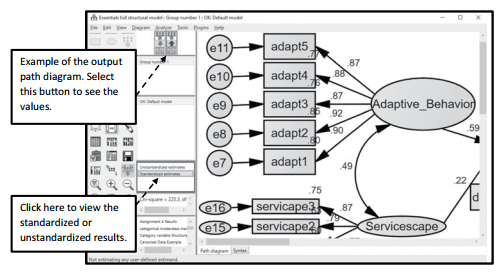
Figure 5.16 View Input/Output Results on the Graphic Interface Page
Source: Thakkar, J.J. (2020). “Procedural Steps in Structural Equation Modelling”. In: Structural Equation Modelling. Studies in Systems, Decision and Control, vol 285. Springer, Singapore.
27 Mar 2023
30 Mar 2023
27 Mar 2023
27 Mar 2023
30 Mar 2023
20 Sep 2022